- Handelsplattformen
- Plattformen
- Bedienungsanleitung
- Gebrauchsanweisung für NetTradeX iOS
- Eröffnung eines Charts
Eröffnung eines Charts
1. Installation eines Charts
Für die Eröffnung des entsprechenden Charts klicken Sie im Window "Preisnotierungen" auf das Instrument. Beispiel eines Charts:
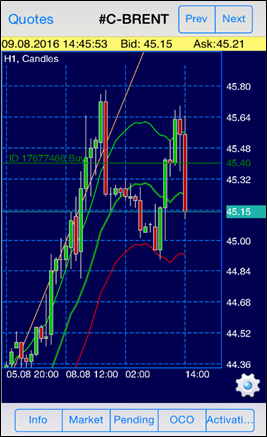
Sie können das Chart nach rechts oder nach links mit dem Fingerdruck auf dem Gebiet der Abbildung bewegen. Wenn Sie mit dem Finger die Zeitskala bewegen, wird das Chart enger oder breiter, je nach der Richtung der Bewegung. Die Fingerbewegung auf der Preisskala presst zusammen oder dehnt das Chart nach der Vertikale aus.
2. Einstellungen des Charts
Unter dem Chartwindow befindet finden Sie fünf Tasten sowie eine Taste für die Einstellung von Chartparametern (etwas höher) als grünes Icon. Beim Klicken auf den Button wird ein zusätzliches Window an der unteren Part des Bildschirmes eröffnet:
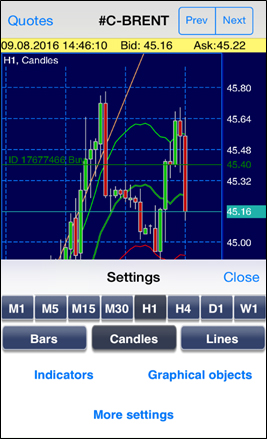
In diesem Window können Sie den Zeitrahmen fürs Chart auswählen, Indikatoren und grafische Objekte einstellen.
3. Indikatoren
With the "Indicators" function in lower part of the window (in edit mode) you may call out the dialog to set indicators for technical analysis and modify the already set indicators:
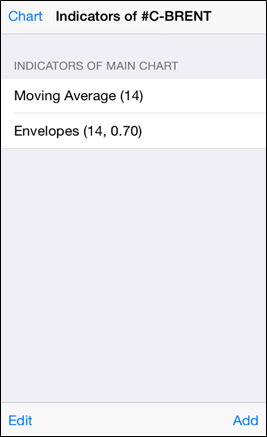
In this window you may do the following:
- "Edit" button - to delete indicators from the list of previously set on the chart;
- "Add" button - to install new indicators;
- by clicking on the line with indicator in the list of the set ones you may alter parameters of this indicator;
- "Chart" button - to return back to chart window.
"Add" button calls the window with menu of group indicators:
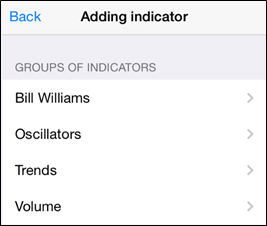
Let's choose, for example, the "Oscillators" group - a window with indicators of this type will open:
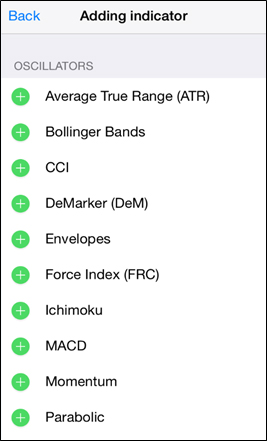
Let's choose the "Envelopes" indicator and set its variables (numeric and colouring):
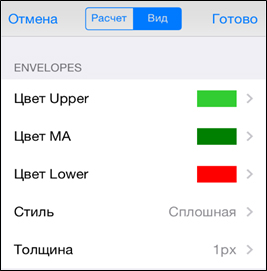
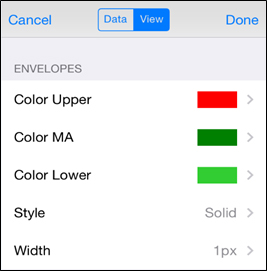
The "Done" button will display the indicator in the chart.
4. Grafische Objekte
With the "Graph. objects" function in lower part of the screen (in edit mode) you may call out the dialog to set graphical object and to edit the already set objects:
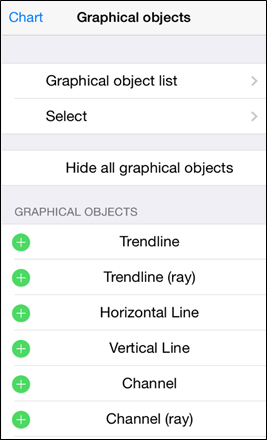
Having chosen, for instance, "Trendline (ray)" we will see the chart with trendline in the active navigation mode, that can be transferred with a finger placed on the screen on one of the section ends or on its middle:
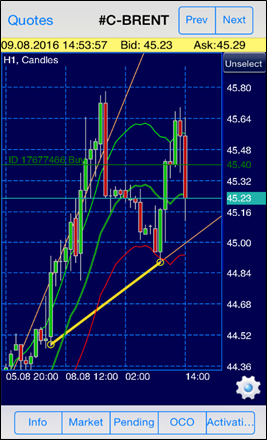
To transfer the object from active mode to the usual one choose of the options below:
- click on "Unselect" button in upper part of the vertical chart scale;
- hold with a finger an object for a couple of seconds and choose the "Unselect" function in the opened context window;
- in menu of graphical objects choose the "Select >" function, tick the needed object and click on "Unselect all".
Delete the graphical object or transfer it into the active mode in the context menu or through the menu of graphical objects.
