- Analisi
- Analisi Tecnica
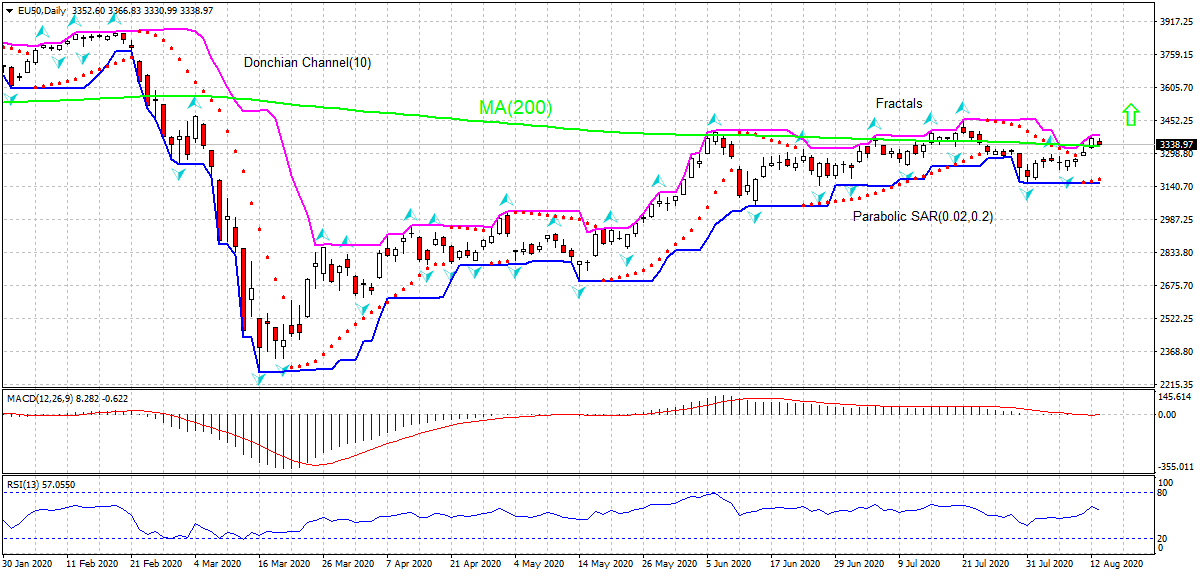
EU 50 50 Analisi Tecnica - EU 50 50 Trading: 2020-08-14
Euro Stoxx 50 Technical Analysis Summary
Sopra 3380.50
Buy Stop
Sotto 3156.91
Stop Loss
| Indicator | Signal |
| RSI | Neutro |
| MACD | Buy |
| Donchian Channel | Neutro |
| MA(200) | Buy |
| Fractals | Neutro |
| Parabolic SAR | Buy |
Euro Stoxx 50 Chart Analysis
Euro Stoxx 50 Analisi Tecnica
On the daily timeframe the EU50: D1 is testing the 200-day moving average MA(200) which has leveled off. We believe the bullish momentum will continue after the price breaches above the upper boundary of Donchian channel at 3380.50. A level above this can be used as an entry point for placing a pending order to buy. The stop loss can be placed below 3156.91. After placing the order, the stop loss is to be moved every day to the next fractal low, following Parabolic signals. Thus, we are changing the expected profit/loss ratio to the breakeven point. If the price meets the stop loss level (3156.91) without reaching the order (3380.50), we recommend cancelling the order: the market has undergone internal changes which were not taken into account
Analisi Fondamentale Indici - Euro Stoxx 50
Euro-zone’s economic reports were mostly positive recently. Will the EU50 rebound continue?
Euro-zone economic data in the recent couple of weeks were positive on balance. While industrial production increase in June was not as steep as expected, the retail sales growth of 1.3% over year was above an expected decline of 0.5%. Both manufacturing and services sectors resumed expanding in July according to Markit’s manufacturing and services PMIs reports, and construction sector contraction slowed as evidenced by construction PMI reading of 48.9 after 48.3 in June. Readings above 50.0 indicate industry expansion, below indicate contraction. Improving data are bullish for EU50. On the other hand, second estimate of Q2 GDP report will be published today at 13:00 CET, and a steep drop in gross domestic report is expected. Worse than expected GDP report is a downside risk for EU50.
Note:
Questa panormaica è di carattere informativo-educativo e viene pubblicata gratuitamente. Tutti i dati compresi nella panoramica sono ottenuti da fonti pubbliche conosciute più o meno affidabili. Inoltre non c'è alcuna garanzia che le informazioni fornite siano precise e complete. Le panoramiche non vengono aggiornate. Tutta l'informazione in ciascuna panoramica, compresi indicatori, opinioni, grafici e o quant'altro, è fornita a scopo conoscitivo e non è un consiglio finanziario. Tutto il testo e qualsiasi delle sue parti, e anche i grafici non possono essere considerati un'offerta per effettuare un'operazione con un qualsiasi asset. IFC Markets e i suoi impiegati in alcun caso non sono responsabili per qualsiasi azione intrapresa sulla base delle informazioni contenute.


