- Formazione
- Analisi Tecnica
- Indicatori Tecnici
- Indicatori di Bill Williams
- Alligator
Indicatore Alligator - Williams Alligator
Cos'è l'Indicatore Williams Alligator?
L´Indicatore Bill Williams Alligator è uno strumento di analisi tecnica sul grafico composto di 3 medie mobili livellate fissate a periodi 13, 8 e 5 e spostate rispettivamente di 8, 5 e 3 barre, che segnala l'assenza, la formazione e la direzione di una tendenza.
Ma perché Bill WIlliams confronta l'indicatore creato con una bestia? Bill Williams ha usato l'analogia con l'alligatore per descrivere il modo in cui i mercati passano da non avere tendenza ad avere tendenza e viceversa.


Bill Williams ha inventato molti indicatori e ha dato loro nomi unici e accattivanti, come Awesome Oscillator, Gator Indicator, Alligator Indicator.
Come si Utilizza Indicatore Alligator
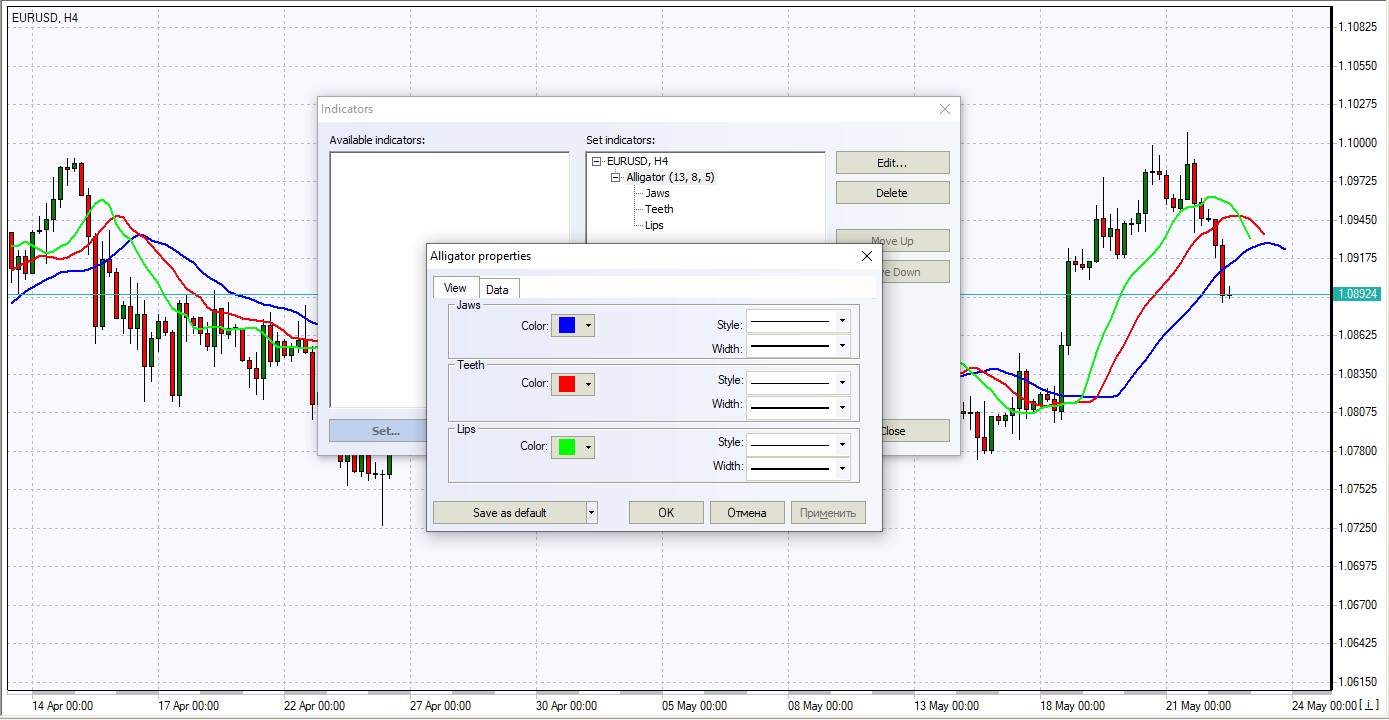
L'Alligator è composto da medie mobili smoothed a 13-, 8- e 5 periodi spostate in avanti di 8, 5 e 3 barre rispettivamente le quali sono colorate di blu, rosso e verde rappresentando la mascella, i denti e le labbra dell’alligatore.
Quando le tre linee si incrociano l’Alligatore sta dormendo. Più grande diventa la distanza tra le medie mobili, più presto avverrà il movimento dei prezzi.
Il movimento delle medie mobili verso l'alto (verde seguita dalla rossa e blu), ci segnala una fase di acquisto con un trend al rialzo.
Se le medie mobili sono disposte nell'ordine contrario verso il basso, si ha un forte segnale di vendita.

Indicatore Alligator
Formula Indicatore Alligator
PREZZO MEDIO = (MASSIMO+ MINIMO) / 2
MASCELLA = SMMA (PREZZO MEDIO, 13, 8)
DENTI = SMMA (PREZZO MEDIO, 8, 5)
LABBRA = SMMA (PREZZO MEDIO, 5, 3)

Come utilizzare l'indicatore Alligator sulla piattaforma di trading
Forex Indicators FAQ
What is a Forex Indicator?
Forex technical analysis indicators are regularly used by traders to predict price movements in the Foreign Exchange market and thus increase the likelihood of making money in the Forex market. Forex indicators actually take into account the price and volume of a particular trading instrument for further market forecasting.
What are the Best Technical Indicators?
Technical analysis, which is often included in various trading strategies, cannot be considered separately from technical indicators. Some indicators are rarely used, while others are almost irreplaceable for many traders. We highlighted 5 the most popular technical analysis indicators: Moving average (MA), Exponential moving average (EMA), Stochastic oscillator, Bollinger bands, Moving average convergence divergence (MACD).
How to Use Technical Indicators?
Trading strategies usually require multiple technical analysis indicators to increase forecast accuracy. Lagging technical indicators show past trends, while leading indicators predict upcoming moves. When selecting trading indicators, also consider different types of charting tools, such as volume, momentum, volatility and trend indicators.
Do Indicators Work in Forex?
There are 2 types of indicators: lagging and leading. Lagging indicators base on past movements and market reversals, and are more effective when markets are trending strongly. Leading indicators try to predict the price moves and reversals in the future, they are used commonly in range trading, and since they produce many false signals, they are not suitable for trend trading.
Ampia Scelta di Piattaforme di Trading per Tutti i Dispositivi


