- Trading
- Specifiche di Strumenti
- Biblioteca di Strumenti Sintetici
- Valute rispetto a USD Investimento
Negozia Valute rispetto a USD - &VSUSD_Index
Valute rispetto a USD Investimento
Tipo:
PCIStrumento : &VSUSD_Index
Indice “Valute rispetto a USD” Descrizione
L'indice di valuta viene utilizzato per mostrare il movimento della valuta americana USD rispetto alle altre valute Forex. Un portafoglio delle valute più liquide - EUR, GBP, JPY, AUD, CHF, e CAD viene utilizzato come indicatore sistemico di mercato.
Vantaggio
- La reazione dell'indice agli eventi fondamentali nell'economia degli Stati Uniti è la più ovvia e stabile;
- L'indice forma un canale di trend stabile adatto al trading di posizioni;
- La sensibilità dell'indice agli eventi fondamentali in altre zone di valuta è poca. Questo permette di rilevare l'andamento del trend di bassa volatilità dell'indice che caratterizza oggettivamente lo stato dell'economia degli Stati Uniti.
Le basi teoriche per la costruzione dello strumento sono riportate qui sotto nella sezione "Campo di applicazione".
Struttura
Parametri
Orari di Trading
Campo di applicazione
Struttura
| &VSUSD_Index | № | Asset | Volume / 1 PCI | Percentuale | Volume (USD) / 1 PCI | Unità di misura |
|---|---|---|---|---|---|---|
| Parte base | 1 | EUR | 107.8657 | 12.700 | 127.0000 | EUR |
| 2 | JPY | 17196.2752 | 14.500 | 145.0000 | JPY | |
| 3 | GBP | 115.3631 | 17.500 | 175.0000 | GBP | |
| 4 | CHF | 194.8028 | 19.100 | 191.0000 | CHF | |
| 5 | AUD | 222.0532 | 18.100 | 181.0000 | AUD | |
| 6 | CAD | 215.1918 | 18.000 | 180.0000 | CAD | |
| Parte quotata | 1 | USD | 1000.000 | 100.0000 | 1000.0000 | USD |
Parametri
| Standard | Beginner | Demo | |
|---|---|---|---|
| Spread Fisso in pips | |||
|
Spread Fluttuante in pips | |||
| Distanza di ordini in punti | |||
|
Swap in punti (Lungo/Corto) | |||
|
Volumi disponibili | |||
| Il valore di 1 pip in USD per il volume Vol |
Orari di Trading
| Giorni della settimana | Orari di trading (CET) | Orari di trading locali |
| Lunedì | 00:00 — 24:00 | 00:00 — 24:00 |
| Martedì | 00:00 — 24:00 | 00:00 — 24:00 |
| Mercoledì | 00:00 — 24:00 | 00:00 — 24:00 |
| Giovedì | 00:00 — 24:00 | 00:00 — 24:00 |
| Venerdì | 00:00 — 22:00 | 00:00 — 22:00 |
| Saturday | — | — |
| Domenica | — | — |
Campo di applicazione
In the foreign exchange turnover study carried out by the Bank of International Settlement in April 2013 (http://www.bis.org/) 7 leading currencies, which we have included for considering, stand out in monthly exchange turnover volumes:
| Valute | Quota del fatturato, % |
| USD | 43.5% |
| EUR | 16.7% |
| JPY | 11.5% |
| GBP | 5.9% |
| AUD | 4.3% |
| CHF | 2.6% |
| CAD | 2.3% |
Тable 1. Central banks foreign turnover. April 2013.
In the right column the respective shares of currencies in the overall foreign exchange turnover of regulators are presented in descending order. We didn’t include in the systemic index the currencies that accounted for less than 2% of turnover.
In creating the index we consider (quote) the “portfolio standard”, composed of 6 remaining liquid currencies: [EUR+JPY+AUD+CHF+CAD] against the US dollar. The weight optimization is carried out so that the standard possesses the minimum sensitivity with respect to the events in US. The weights, which correspond to the quoted standard, are selected on the basis of currency zone “non-interference” principle.
Let us explain the application of that principle. The table of liquid currency priority for foreign exchanges quoted against euro is made on the basis of foreign exchange turnover 2013 study.(http://www.bis.org/publ/rpfx13fx.pdf)
| Currency pair | Turnover share, % | Residual influence share, % |
| EUR/USD | 24.1 | 41 |
| EUR/JPY | 18.3 | 46.8 |
| GBP/USD | 8.8 | 56.3 |
| AUD/USD | 6.8 | 58.3 |
| CAD/USD | 3.7 | 61.4 |
| CHF/USD | 3.4 | 61.7 |
Тable 2. Currency pair monthly turnover. April 2013.
The total share of dollar turnover relative to the liquid instruments under consideration is 65.1%. Then the residual share is equal to the difference between the total share and the x/USD currency pair share.
The residual share characterizes the currency (USD) stability with respect to changes in the price of the base part. In order to introduce significant volatility into the index the participation of remaining “counterpart” currencies (x/USD) is required with the weights equal to their share in the foreign exchange operations. Therefore the values from the right hand column of the Table 2 were applied for determining the currency weights for creation of the index.
Let us remind that the structure of the &VSUSD_Index index can be represented as follows:
We shall take the weights for the standard proportional to the residual influence share (the right hand column of the Table 2). Thus, we are raising the index stability with respect to events in the dollar economic zone. Then it is the quoted part – USD that determines the index sensitivity. The estimates yield the following formula for the portfolio standard:
EUR(12.7%) + JPY(14.5%) + GBP(17.5%) + CHF(19.1%) + AUD(18.1%) + CAD(18.1%).
The instrument &VSUSD_Index is highly sensitive with respect to fundamental changes in US economic development and therefore ideally suits for trend following strategy in periods when key fundamental events are anticipated: the FED president announcements, releases of Nonfarm Payrolls and consumer price indexes (Core CPI) and etc.
In NetTradeX trading platform buying the instrument means capital allocation between a long position in the portfolio standard:
EUR(12.7%) + JPY(14.5%) + GBP(17.5%) + CHF(19.1%) + AUD(18.1%) + CAD(18.1%)
and a short position in USD.
As a result, the PCI is formed using the GeWorko.
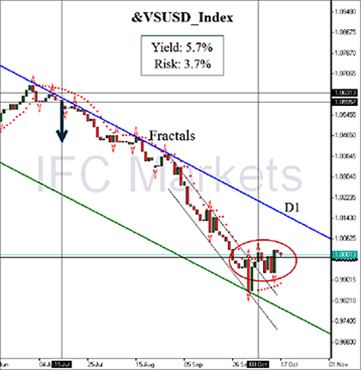
Let us consider the case presented in the figure below. At a Senate hearing on July 15, 2014 Janet Yellen, Federal Reserve Chair, announced that if the labor market continued to stabilize then the first increase in the federal funds rate would occur sooner than previously planned. The Federal Reserve Chair added also that in the future the federal funds rate would increase more rapidly. On July 17 the Unemployment Claims figure proved there were grounds for optimism: 302 thousand claims were filed against 305 thousand filed during the previous month. First signs of labor market stabilization were recorded in the previous month: the unemployment rate declined from 6.3% to 6.1%. This trend reinforced the investor expectations for federal funds rate increase, which can strengthen the national currency. The vertical line on the figures marks the date of the FED Chair’s testimony.
As it is evident from the first figure the PCI (Personal Composite Instrument) price on July 15 breached the lower side of the triangle and formed a new falling trend channel, which confirms the strengthening of the US dollar against the remaining Forex segment. For the 85-day period of the trend channel existence the short position on index yielded profitability equal to 5.7%. The trend channel width that characterizes volatility or risk, amounted to 3.7 % of the starting price. We can estimate the position trading return by the profitability to risk ratio: 1.5 (>1). Thus the index is attractive enough for position trading.

Fig.1. D1&VSUSD_Index chart

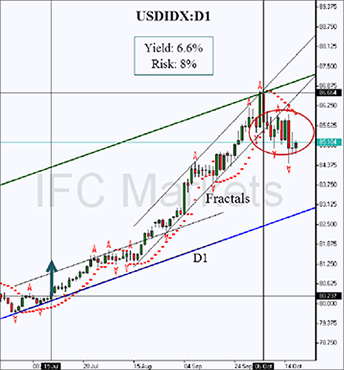
Fig.2. D1 USDIDX chart
It should be noted that the classical dollar index USDIDX reaction to the same event was less effective (Fig.2). The profitability of the long position equaled 6.6% and the volatility 8%. Thus the index return of 0.8 was almost two times lower than that of the instrument: 0.8 vs. 1.5. Note that the implied position was closed in both cases when the daily trend channel was breached. The position was opened when the closest resistance level was crossed after July 15. This level was determined by the Bill Williams fractal and was equal to 1.05957 for the &VSUSD instrument (see Fig. 1).
As it is evident from the example, besides the attractiveness for trend trading our instrument allows to diversify the risks and avoid false instability. Note that after Janet Yellens testimony the fundamental events related to the developed economies of the remaining currency zones didn’t impact the index movement: the PCI filtered out the volatility. For example, on 4 September, 2014 a key EC monthly indicator – change in German Factory Orders was published. The indicator came out higher than the previous month’s reading (4.6% vs. -2.7%). Furthermore, this was the first period when positive growth was recorded for the industry of a key EU economy in a long time. Nevertheless, the &VSUSD_Index reaction was more than calm: the trend continued with a small correction. The individual risks connected with sharp changes in any of the developed economies are reduced due to the standard. It should be noted, that the optimization based on the “non-interference principle” allows to increase substantially the profitability and return. It should be noted also that the trend channel lasted longer than the classical USDIDX index channel.
Per negoziare gli strumenti PCI offerti esclusivamente da IFC Markets, è necessario aprire un conto gratuito e scaricare la piattaforma NetTradeX.
- I Clienti Negoziano Anche i Seguenti Strumenti


