- Analytik
- Technische Analyse
USD/NOK Technische Analyse - USD/NOK Handel: 2021-05-24
USD/NOK Technical Analysis Summary
Above 8,43
Buy Stop
Below 8,13
Stop Loss
| Indicator | Signal |
| RSI | Neutral |
| MACD | Buy |
| MA(200) | Neutral |
| Fractals | Neutral |
| Parabolic SAR | Buy |
| Bollinger Bands | Neutral |
USD/NOK Chart Analysis
USD/NOK Technische Analyse
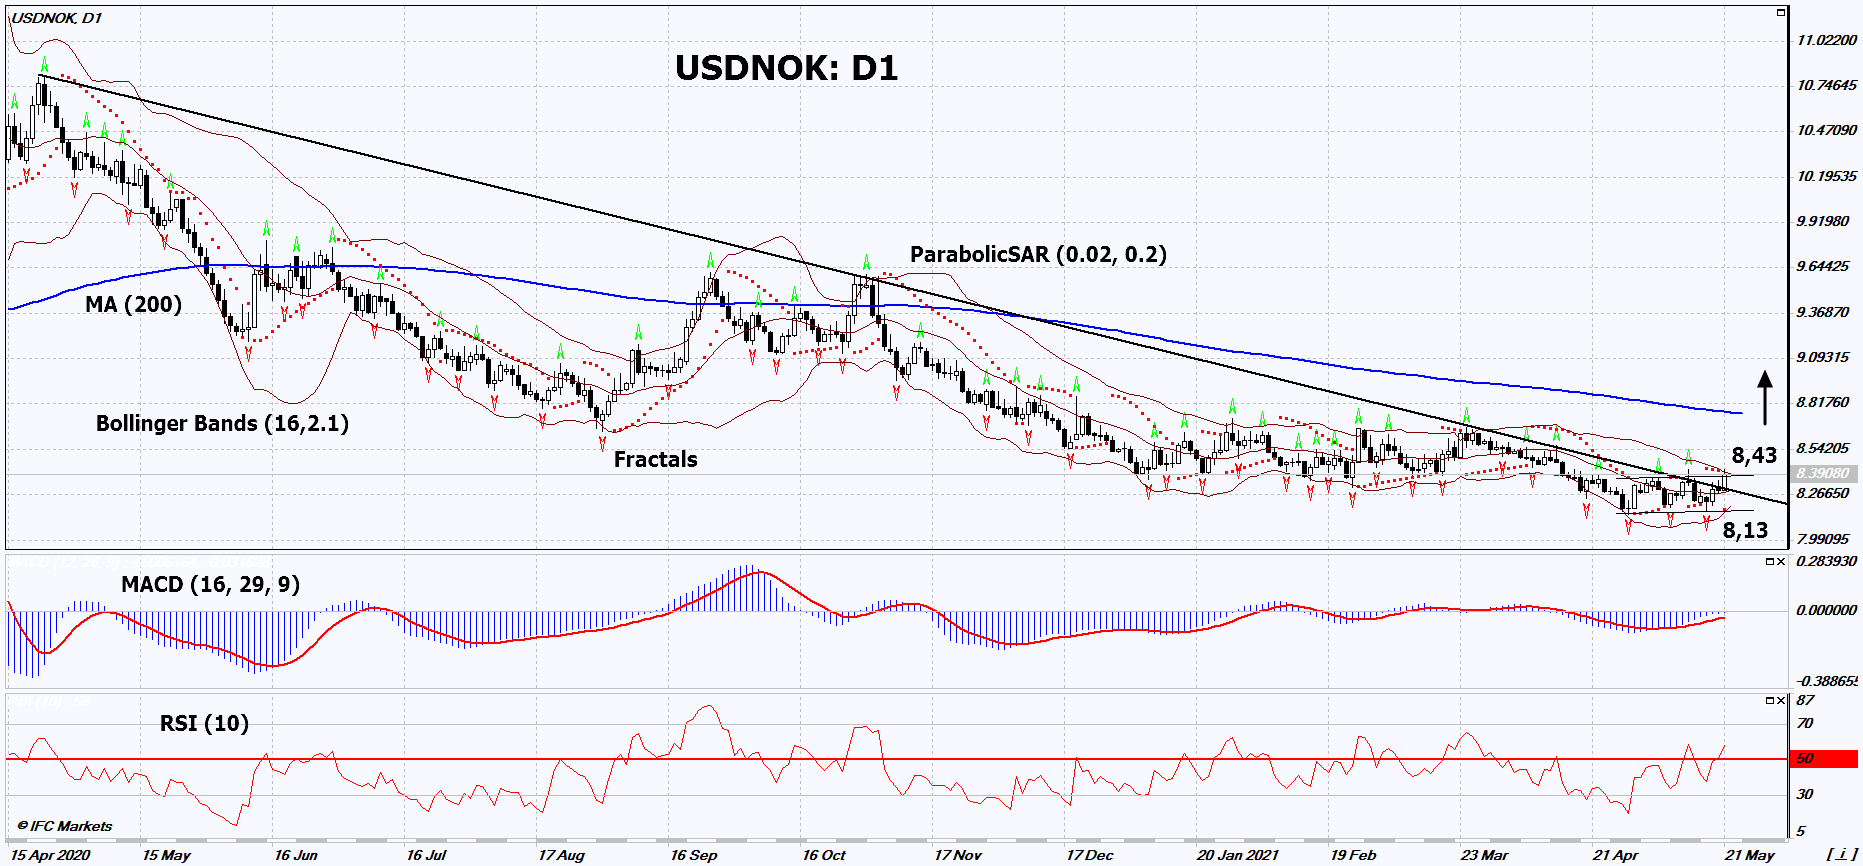
On the daily timeframe, USDNOK: D1 broke up the resistance line of the long-term downtrend. A number of technical analysis indicators have formed signals for further growth. We do not exclude a bullish movement if USDNOK rises above the last upper fractal and upper Bollinger band: 8.43. This level can be used as an entry point. The initial risk limitation is possible below the Parabolic signal, 3 lower fractals, the minimum since October 2018 and the lower Bollinger band: 8.13. After opening a pending order, we can move the stop-loss to the next fractal low following the Bollinger and Parabolic signals. Thus, we change the potential profit / loss ratio in our favor. After the transaction, the most cautious traders can switch to the four-hour chart and set a stop-loss, moving it in the direction of the trend. If the price overcomes the stop-loss (8.13) without activating the order (8.43), it is recommended to delete the order: there are internal changes in the market that were not taken into account.
Fundamentale Analyse Forex - USD/NOK
Weak economic data came out in Norway. Will the USDNOK quotes continue to rise?
An upward movement signifies a weakening of the Norwegian krone against the US dollar. Inflation in Norway has been at a high level for 3 months. In April it was 3% in annual terms. House Price Index in May was 12.3% in annual terms. Meanwhile, since May 2020, the Norwegian Central Bank (Norges Bank) rate is 0%. It is unlikely that index will increase it while macroeconomic indicators remain weak. Norway's foreign trade balance in April amounted to only 17 billion kroner, while the forecast was 20.3 billion kroner. Norwegian GDP in the Q1 of 2021 decreased by 1.4%. This is also worse than expected (-0.6%). Note that the next meeting of Norges Bank will take place on June 17.
Hinweis:
Diese Übersicht hat einen informativen und Tutorencharakter und wird kostenlos veröffentlicht. Alle Daten, die in dieser Übersicht eingeschlossen sind, sind von mehr oder weniger zuverlässigen öffentlichen Quellen erhalten. Außerdem gibt es keine Garantie, dass die angezeigte Information voll und genau ist. Die Übersichten werden nicht aktualisiert. Die ganze Information in jeder Übersicht, einschließlich Meinungen, Hinweise, Charts und alles andere, werden nur für Vertrautmachen veröffentlicht und sind keine Finanzberatung oder Empfehlung. Der ganze Text und sein jeder Teil sowie die Charts können nicht als ein Geschäftsangebot betrachtet werden. Unter keinen Umständen sind IFC Markets und seine Angestellten für die Handlungen, die von jemand anderem während oder nach dem Lesen der Übersicht genommen werden, verantwortlich.


