- Technologien
- Artikel über PCI-Gebrauch
- Spreadhandel
PCI: Commodity Futures - Coffee vs Cocoa
Good afternoon, dear investors. In this review we continue to acquaint you with the opportunities of using the synthetic instrument ( technically - personal composite instrument PCI), based on the PQM model in NetTradeX trading terminal. We want to offer you a synthetic instrument composed of two "Commodity CFD" section components: C-COFFEE, C-COCOA. Let us take a look at the basic supply and demand trends for these two agricultural products.
Coffee firstly was used in Africa, Ethiopia, in the XIV century. Now its main producers are based in Latin America, which accounted for 53% of the world crop. The second place belongs to the countries of Southeast Asia and Oceania, with a share of 33%. The progenitor of coffee, Africa, covers 12% of a world production. Cocoa, by contrast, first appeared among Indians of Latin America, Mayan and Aztec, several thousand years ago. Currently it is grown mainly in Africa. Its share in world production is 74.5%. Latin America grows only 13% of the global cocoa harvest, the rest is grown in Asian countries.
Thus, both crops are grown in the same tropical climatic zone. Moreover, coffee first appeared in Africa, and it is now one of the main agricultural crops of Latin America which is the cocoa country. Typically, individual countries specialize on one of these crops. Except, perhaps, Indonesia, which holds roughly the same shares of coffee and cocoa world production. Here we consider the comparative production table for both crops:
| Cocoa production: | Coffee production: | ||||||||||||||||||||||||||||||||||||||||||||||||||||||||||||||||||||||||||||||||||||||||||||
|
|
As it can be seen from the table, the share of Indonesia in the world cocoa production is 10.2% and 8% in global coffee production. This confirms their theoretical interchangeability. Other countries, except Ethiopia, can produce both cultures, but some specialize only in one of them. In fact, that is the fundament the principle of using the Coffee/Cocoa personal composite instrument is based on. In case of significant differences in the prices of these commodities, farmers may be interested in switching from coffee to cocoa and vice versa, depending on the world situation.
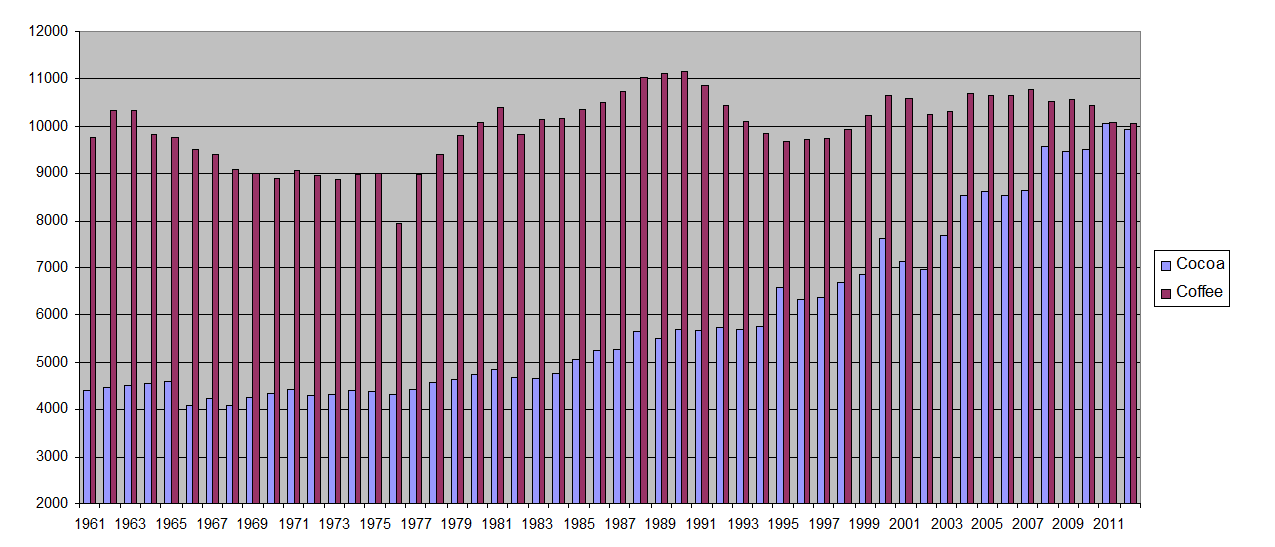
The area of agricultural crops in the world
It can be seen from the chart that an agricultural area under coffee cultivation in the 60s of the last century was in the range of 9-11 million hectares. In our opinion, this is due to the fact that this culture has been a traditional for Latin American countries for a long time. Over the same period, the cocoa farming areas increased almost by 2.5 fold because of African countries. This also contributed to the world demand increase of cocoa and mainly of chocolate products. They are considered useful in western countries. Note that European share of world cocoa consumption is 50%, the share of America - 33% and Asia - 14%. The share of the main cocoa producer - Africa accounts for only 3% of the world consumption. This is not surprising given that the GDP per head in the EU is approximately $30,500, and the largest cocoa producers like Ghana and Côte d'Ivoire have it several times smaller, only $3460 and $1820, respectively.
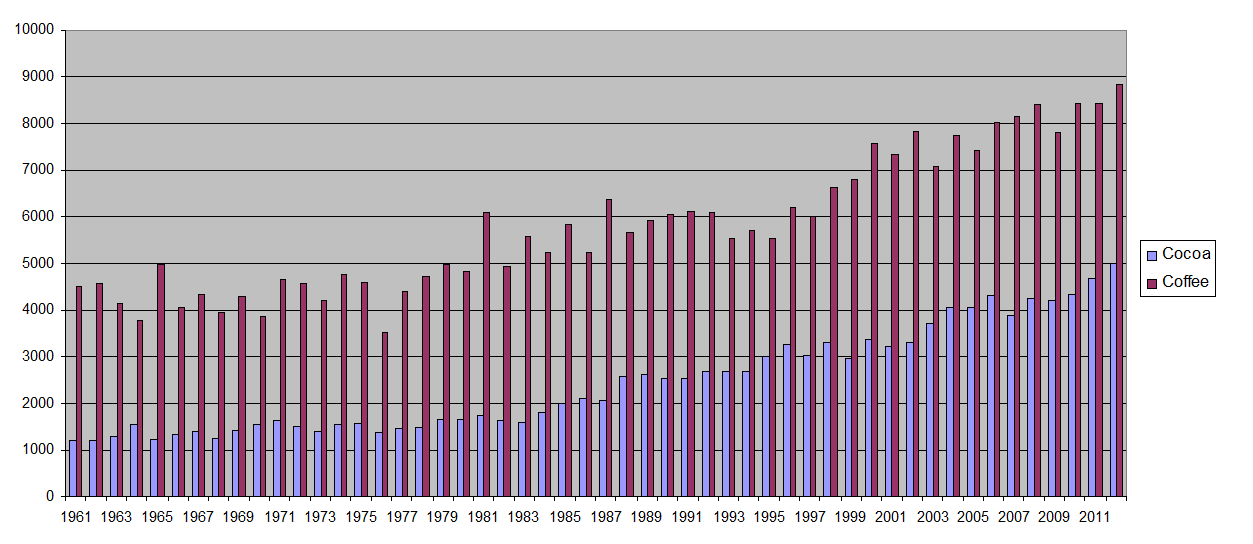
World production of agricultural crops
As a result, the cocoa production has increased fivefold and coffee production - only twice as big over the past 50 years. In our opinion, this is a consequence of the fact that cocoa, despite its long history, is a relatively new mass product in Western countries. It is seen in the previous chart that the agricultural area under coffee, cocoa leveled recently.
The Cocoa deliveries to the world market increased by seven times since early 60s, coffee - by three times. It is much more than production. Note that Latin America consumes about a third of the coffee grown and this proportion is unlikely to increase. At the same time chocolate and cocoa are still rarities in Africa. Theoretically, Africans can significantly increase the chocolate consumption in case their income rise.
The Coffee/Cocoa personal composite instrument application consumes using the possible deviation in prices for these crops from some "fair" level, due to both the production cost and world demand. Theoretically, farmers of major producing countries can partially “replace” one culture for the other, since there are suitable climatic conditions for it. Of course, this can not happen immediately, as the coffee tree life is 60-70 years, and the chocolate tree (cocoa) is 30 to 80 years. The agricultural using terms of trees are smaller of course. This PCI, in our opinion, will tend to a certain average value in case of strong deviations. Let us take a look at the price charts of both PCI components. For coffee, we will use the "Arabica" price. Its share in the world production reaches 80%, and almost everything else falls on another kind of coffee - "Robusta". Together they cover 98% of world production.
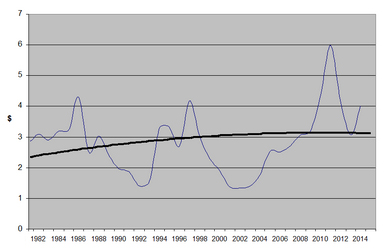
Arabica Coffee price, $/kg
As it can be seen from the chart, the Coffee have been experiencing more than 50 years of significant fluctuations in the range of $1 to $ 6 per kilogram. The polynomial average of the price is marked with the black line on the chart. It has been about $3 per kg within the past 20 years.
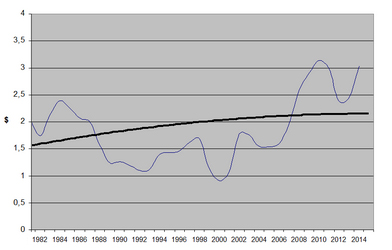
Cocoa price, $/kg
The Cocoa has a similar chart observed. This is due to the fact that chocolate trees actively fruit within 25 years after which they must be replaced. At this point, there is a surge in prices for the Cocoa. The prices rose particularly strong in the late 70s. After that, they also grew in the early 2000s, but the increase was not so powerful because of the global economic crisis in 1997-2000. The polynomial average of the price is marked with the black line on the chart. It has been about $2 per kg, or one-third lower than the coffee price.
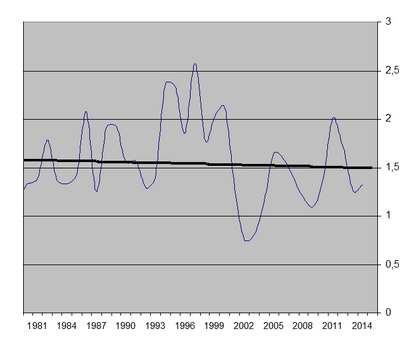
PCI in real prices
In this picture, we have built the yearly chart for the Coffee/Cocoa PCI within the last 30 years based on their average price per kilogram. As we can see, the PCI has been fluctuated around 1.5, and since the 2000s it has shown a tendency to increase. The low at 0,763 has been reached in 2002. The level 2.5 was exceeded by the PCI twice - in 1965. Since the beginning of December last year, the PCI rose from 0.88 to 1.73 at the end of April. So it returned to the long-term average and even slightly exceeded it. In our opinion, the PCI will continue to be in the neutral trend. This feature can be theoretically used for profit taking, while opening a position in the corresponding direction at the upper or lower limit of the range.
In conclusion, we would like to note the risk factors that may prevent or delay the Coffee/Cocoa PCI return of to the average level.1. The coffee yield is 1.5 – 2 times higher than the Cocoa. One hectare can provide about 600-1000 kg of coffee or 400-500 kg of cocoa. While the coffee is still 1.5 fold more expensive than the cocoa. Theoretically, it could lead to the replacement of African cocoa farmers on coffee half - two times higher than that of cocoa. One hectare can collect about 600-1000 kg 400-500 kg of coffee or cocoa. While coffee is still more expensive than cocoa by 0.5. Theoretically, it could lead African cocoa farmers to the replacement cocoa by coffee. 2. We do not exclude the consumption growth in African cocoa-producing countries in the case of increasing incomes. They grow almost two-thirds of the global harvest and consume less than 5%.
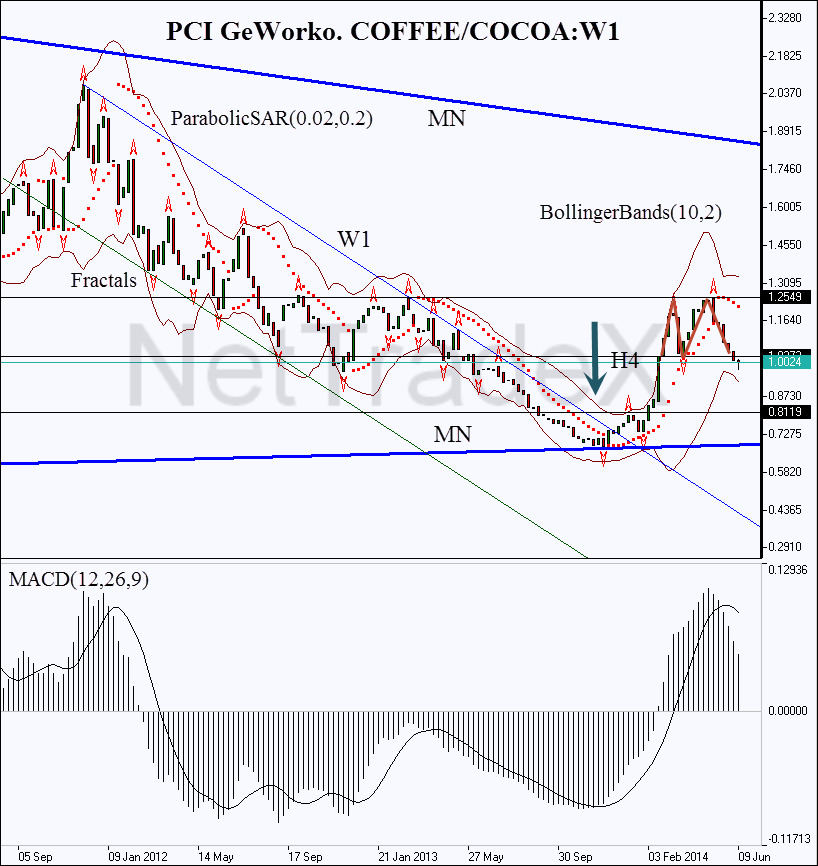
With the strong influence of these factors, PCI will be retained in a falling trend for some time. We see this situation on the COFFEE/COCOA weekly chart, built within the NetTradeX trading platform.
The price formed a double bottom pattern based on the resistance at 1.2549 – the bearish activity pre-alarm. The downward trend is confirmed by the ParabolicSAR trend indicator, as well as the Bollinger channel reversal. No contradictions from MACD as well – the signal line (9 weeks) turned into the red zone.
The price has broken the fractal resistance at 1.0273 and drifts around 1.0024. A short position can be open immediately but it would be wise to set the SL around 1.2549. This value is confirmed by the Bill Williams fractal and ParabolicSAR historical values. Conservative investors are recommended to take profits above the next key level at 0.8119 after they sell the CFD for COFFEE/COCOA PCI. Do not forget that the PCI price deviated below the average and will probably return to the previous historical highs. And so after the profit-taking, we should be ready for the opening a long position at the monthly support line.
It is important to note the expediency of trading the PCI in a long term. For a quantitative analysis of spread effectiveness it is useful to apply the linear correlation coefficient (LCC), which takes values in the range of -1 to 1. This indicator expresses the degree of relatedness of the two assets. Here we consider the correlation between two PCI assets: base one (Coffee) and the quoted one (Cocoa). With negative values, we can talk about reverse connectedness: the base asset fall triggers the quoted asset growth and vice versa. In this case, the PCI has a sharp trend component due to the spread divergence. We attached the a weekly chart coffee indicator showing the linear correlation coefficient - IND_Correlation values, which is freely available online on the MQL4 community.
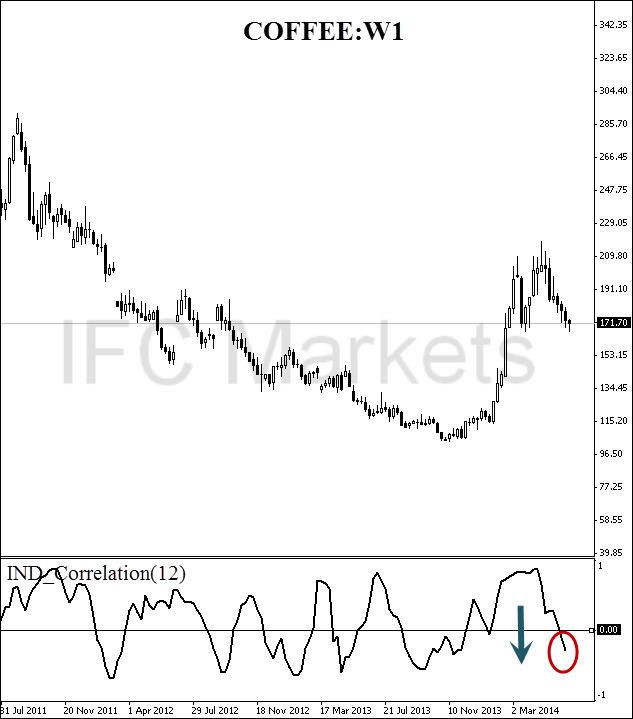
Here we consider the quarterly analysis horizon - 12 weekly bars. At the moment, we see that the signal moved into the negative zone, that allows effectively get to the spread trading with the 1Q horizon.
Vorige Artikel
- Vergleich der Wertentwicklung der japanischen Aktienbörse gegen die US-Aktienbörse
- Vergleich der Wertentwicklung der deutschen Aktienbörse mit der US-Aktienbörse
- Arbitrage Trading | FCATTLE/SOYB - The Efficiency Analysis
- PCI on Agricultural Futures: Wheat Futures and Feeder Cattle
- New Corporate Report - Google Stocks, Apple Stocks
- Spread Trading | Stock Trading - Google Stocks, Apple Stocks
