- Analýza
- Technická analýza
AUD/USD Technická analýza - AUD/USD Obchodování: 2021-07-01
AUD/USD Technical Analysis Summary
níže 0.7477
Sell Stop
výše 0.7616
Stop Loss
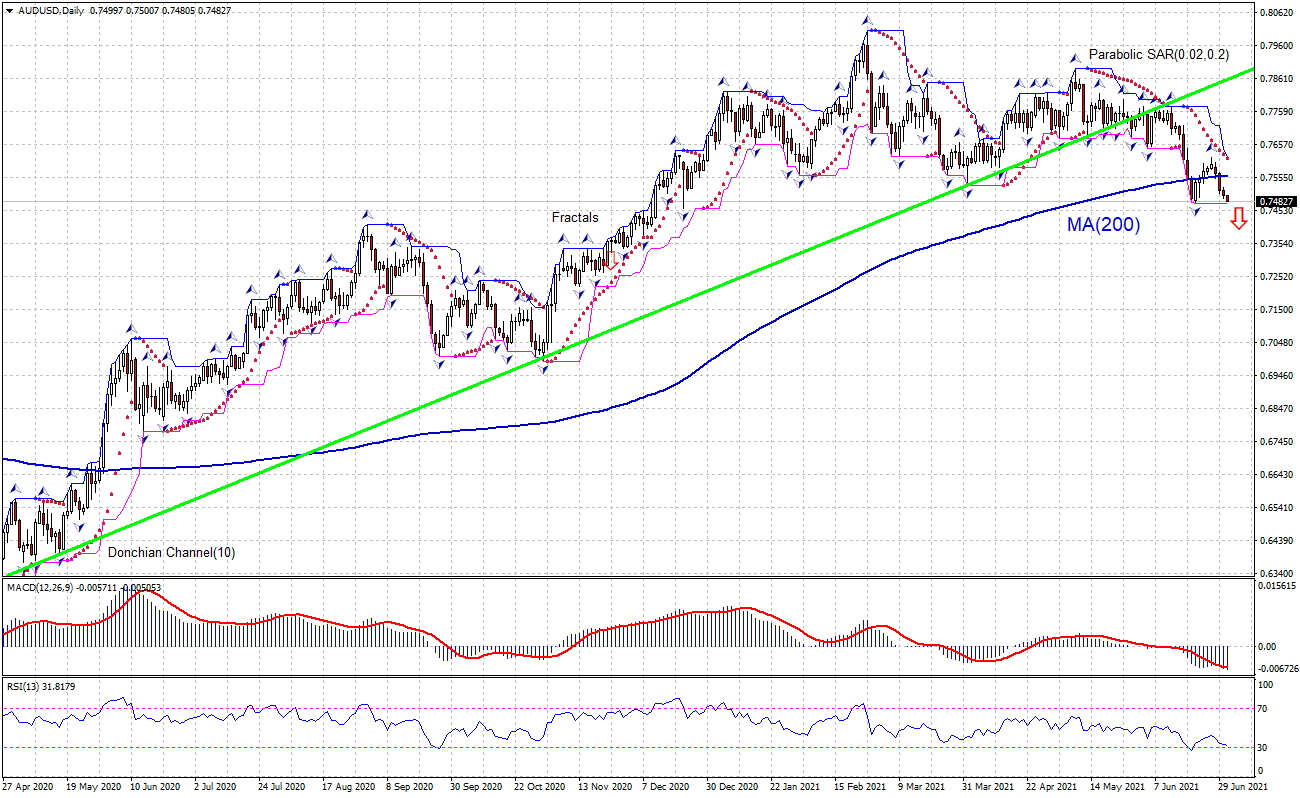
| Indicator | Signal |
| RSI | Neutrální |
| MACD | Sell |
| Donchian Channel | Sell |
| MA(200) | Sell |
| Fractals | Sell |
| Parabolic SAR | Sell |
AUD/USD Chart Analysis
AUD/USD Technická analýza
The AUDUSD technical analysis of the price chart on daily timeframe shows AUDUSD,Daily has fallen below the 200-day moving average MA(200) which continues to rise. We believe the bearish movement will continue after the price breaches below the lower bound of the Donchian channel at 0.7477. A level below this can be used as an entry point for placing a pending order to sell. The stop loss can be placed above 0.7616. After placing the order, the stop loss is to be moved to the next fractal high indicator, following Parabolic signals. Thus, we are changing the expected profit/loss ratio to the breakeven point. If the price meets the stop loss level without reaching the order, we recommend cancelling the order: the market has undergone internal changes which were not taken into account.
Fundamentální analýza Forex - AUD/USD
Australia’s economic performance continues to improve. Will the AUDUSD decline reverse?
Australia’s economic data of the last couple of weeks indicate Australia’s economic performance continued to improve. Unemployment declined in May, the trade surplus rose in May, and manufacturing and services sectors continued to expand in June albeit at lower pace. Thus, unemployment rate fell to 5.1% from 5.5% in April, the trade surplus rose to A$9.68 billion from A$8.16 in April, and manufacturing and services PMIs declined to 58.4 and 56 from 60.4 and 58 in April correspondingly. Readings above 50 indicate industry expansion, below indicate contraction. Positive Australin statistics is bullish for AUDUSD, however the technical setup is bearish for AUDUSD currently.
Explore our
Trading Conditions
- Spreads from 0.0 pip
- 30,000+ Trading Instruments
- Stop Out Level - Only 10%
Ready to Trade?
Open Account Poznámka:
Tento přehled má informativně poznávací charakter a publikuje se zdarma. Všechny údaje, uvedené v přehledu, jsou získány z otevřených zdrojů, jsou uznávány více méně spolehlivé. Přitom, neexistují žádné garance, že uvedená informace je úplná a přesná. Přehledy se v budoucnu neobnovují. Veškerá informace v každém přehledu, včetně názorů, ukazatelů, grafů, je pouze poskytována a není finančním poradenstvím nebo doporučením. Celý text nebo jeho jakákoliv část a také grafy nelze považovat za nabídku provádět nějaké transakce s jakýmikoliv aktivy. Společnost IFC Markets a její zaměstnanci za žádných okolností nemají žádnou odpovědnost za jakékoli kroky učiněné kýmkoliv po nebo v průběhu seznámení s přehledem.

