- Vzdělávání
- Jak obchodovat na Forexu
- What is Volatility
Benefits of Using Volatility Analysis Tool in Trading
What is Volatility?
Volatility is a statistical measure showing how much the price of an asset fluctuates around its average price. In other words, volatility represents the range to which the price of a security may grow or fall. Volatile assets are considered to be riskier than less volatile ones, as the price is likely to be less predictable.
Autochartist Volatility Analysis
IFC Markets presents you Autochartist, an advanced and multifunctional technical analysis tool which you can get totally free by becoming our client. Among the products provided by Autochartist you will also find the Volatility Analysis Tool, which works based on volatility indicators, 6 months data and provides forecast accuracy of at least 68%. Before introducing this tool, let’s recall the meaning of the term “volatility” in trading and from a trader’s point of view.
How to Use Volatility Analysis in Trading
In this quick overview, we'll look at volatility analysis, discuss the ways it can be used, and the benefits it can give you. Many traders notice that different assets are more/less active during specific timferames, and the Autochartist Volatility analysis tool allows traders to find relevant information on the markets and instruments you trade such as what time of a day/ what day of the week markets are more volatile. The tool also helps to find appropriate entry and exit points for the assets you chose. Based on statistical lows and highs, the Volatility analysis tool can provide you with the probability of upward or downward momentum, the biggest expected price changes on different time frames.
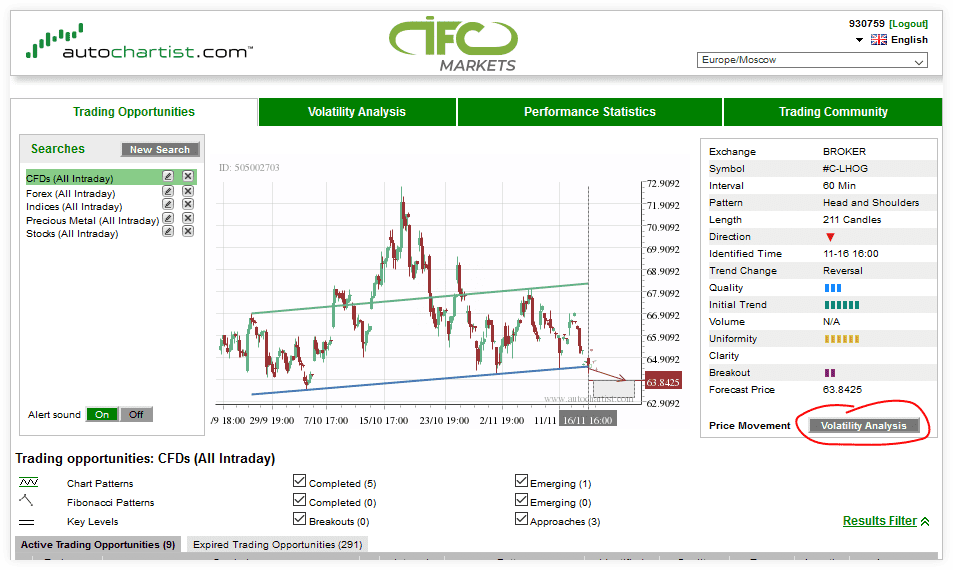
First of all, to get the information on a volatility level of a chosen instrument, click the “Volatility analysis” button in the right bottom corner of the Autochartist Dashboard.

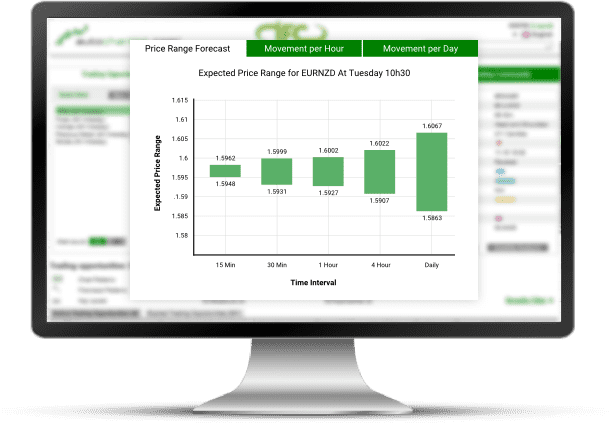
- Price range forecast
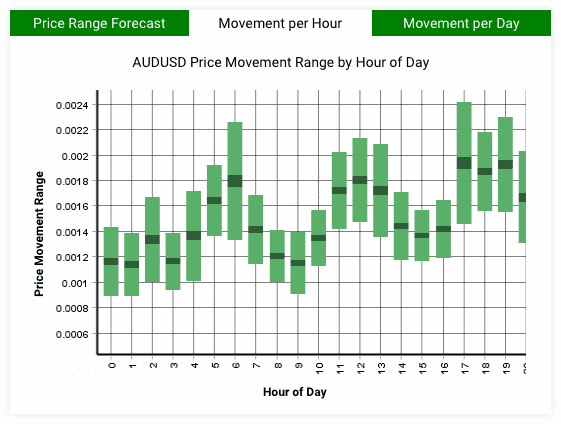
- Movement per hour
- Movement per day

Let’s review each of these sections separately
1. Price range forecast
When opening the Price range forecast, you’ll see 5 green bars growing consistently from left to right. These bars show the price ranges within which the price is expected to be moving. On closer inspection, you can see that the bars represent different timeframes: from 15 minutes to 1 day. The expected price range is the shortest for 15 minutes, and it’s the biggest for the daily timeframe, as larger price movements are expected within a day rather than 15-60 minutes. Actually, this chart is a foresight taken at a specific time, which can be observed right on the top of the screen with 3 sections. This exact chart shows there is 68% likelihood that the price will be between 1.1786 and 1.1775 within 30 minutes from 10:30, Thursday, and on the daily timeframe it may remain between 1.1850 and 1.1720.*


2. Movement per Hour
The next section represents the breakdown of a price action per hour, in other words it helps find out what hours in the day a selected instrument experiences more volatility in price movement. Thus, you can estimate the risk of trading certain instruments during different hours of a day. If you are a risk-averse trader, then you can choose hours with a relatively low volatility level to start trading. Usually markets are the most volatile when the London and New York markets open, and if you don’t mind high-risk trading, that may be the best time for you to earn on markets’ volatility.
3. Movement per Day
The 3rd section of the window shows the price movement per day. It works similar to the movement per hour system and indicates the days of the week with the expected levels of volatility. On some weekdays markets are more or less predictable and quiet (usually on Sundays), while on other days (especially before some news and events) the markets can be highly volatile. The choice of a weekday to trade depends straight on the trader's strategy and the readiness to play a risky game.

*The calculation of probability of 68% is based on 6-month statistical data.
Using Autochartist may be very useful as it constantly scans the market for trading opportunities and saves you a lot of time, providing an overall estimate of risk and volatility of the instrument selected and thus helping to set stop loss and take profit orders correctly.

