- Аналитика
- Технический Анализ
USD/JPY Технический Анализ - USD/JPY Трейдинг: 2025-04-10
USD/JPY Сводка Технического Анализа
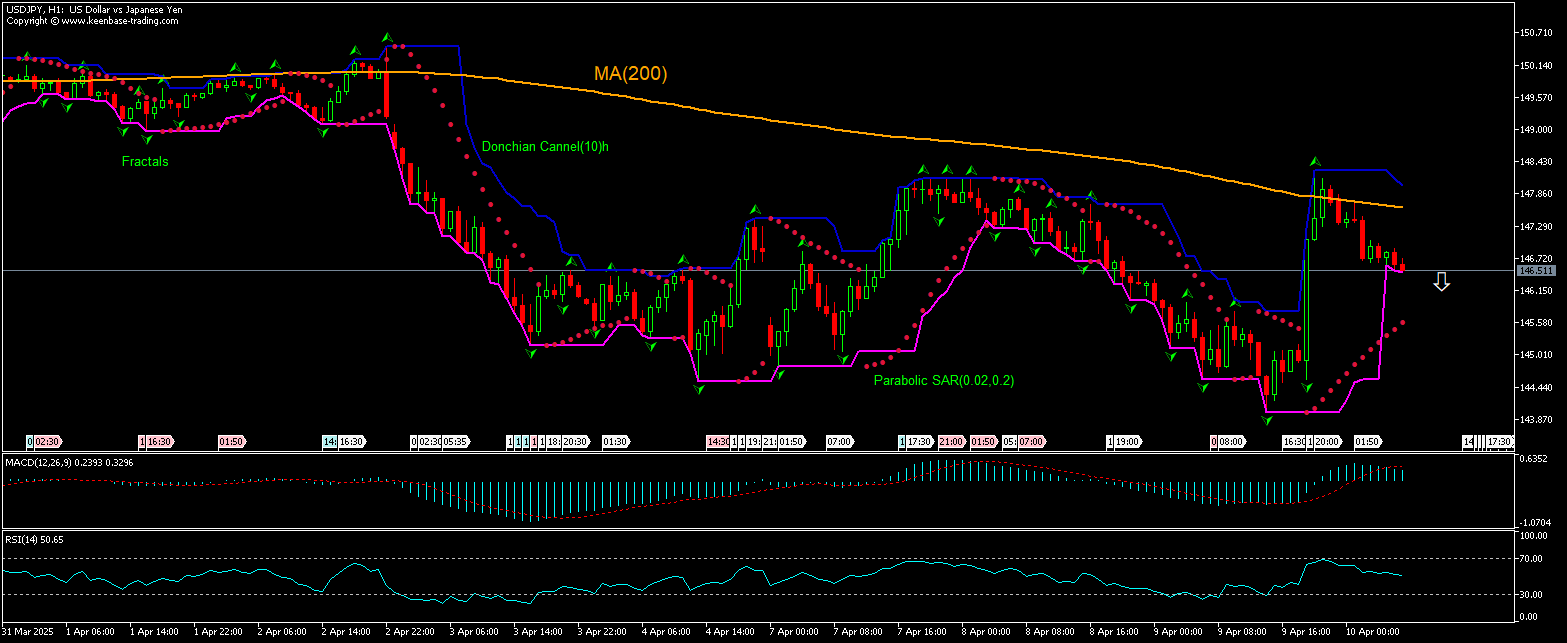
ниже 146.443
Sell Stop
выше 147.613
Stop Loss
| Индикатор | Сигнал |
| RSI | Нейтральный |
| MACD | Продать |
| MA(200) | Продать |
| Fractals | Продать |
| Parabolic SAR | Купить |
| Donchian Channel | Продать |
USD/JPY Графический анализ
USD/JPY Технический анализ
The technical analysis of the USDJPY price chart on 1-hour timeframe shows USDJPY,H1 is retreating after unsuccessful test of the 200-period moving average MA(200) yesterday. We believe the bearish movement will continue after the price breaches below the lower bound of the Donchian channel at 146.443. A level below this can be used as an entry point for placing a pending order to sell. The stop loss can be placed above 147.613. After placing the order, the stop loss is to be moved to the next fractal high , following Parabolic indicator signals. Thus, we are changing the expected profit/loss ratio to the breakeven point. If the price meets the stop loss level without reaching the order, we recommend cancelling the order: the market has undergone internal changes which were not taken into account.
Фундаментальный Анализ Форекс - USD/JPY
Japan’s producer prices inflation accelerated in March. Will the USDJPY price decline?
Japan’s producer prices inflation accelerated in March: the Bank of Japan reported Japan's Producer Price Index (PPI) growth ticked up to 4.2% over year in March after 4.1% growth in February, when a decline to 3.9% rate was expected. It was the 49th straight month of producer inflation, with prices rising further for most components led by non-ferrous metals (12.3% vs 13.4%), and petroleum and coal (8.6% vs 5.9% and 4.7%). Producer prices grew by 0.4% over month, accelerating from 0.2% increase in February and marking the steepest rise in three months. Higher than expected Japan’s producer prices inflation is bullish for yen and bearish for USDJPY currency pair.
Примечание:
Этот обзор носит исключительно информационно-познавательный характер и публикуется бесплатно. Все данные, содержащиеся в обзоре, получены из открытых источников, признаваемых более-менее достоверными. При этом не существует никаких гарантий, что указанная информация является полной и точной. В дальнейшем обзоры не обновляются. Вся информация в каждом обзоре, включая мнения, показатели, графики и всё остальное, предоставлена только в целях ознакомления, и не является финансовым советом или рекомендацией. Весь текст и его любую часть, а также графики нельзя рассматривать в качестве предложения совершать какие-либо сделки с любыми активами. Компания IFC Markets и её сотрудники ни при каких обстоятельствах не несут никакой ответственности за любые действия предпринятые кем бы то ни было после или в ходе ознакомления с обзором.


