- Аналитика
- Технический Анализ
NZD/CAD Технический Анализ - NZD/CAD Трейдинг: 2024-11-06
NZD/CAD Сводка Технического Анализа
ниже 0.82367
Sell Stop
выше 0.83319
Stop Loss
| Индикатор | Сигнал |
| RSI | Нейтральный |
| MACD | Продать |
| Donchian Channel | Продать |
| MA(200) | Продать |
| Fractals | Продать |
| Parabolic SAR | Продать |
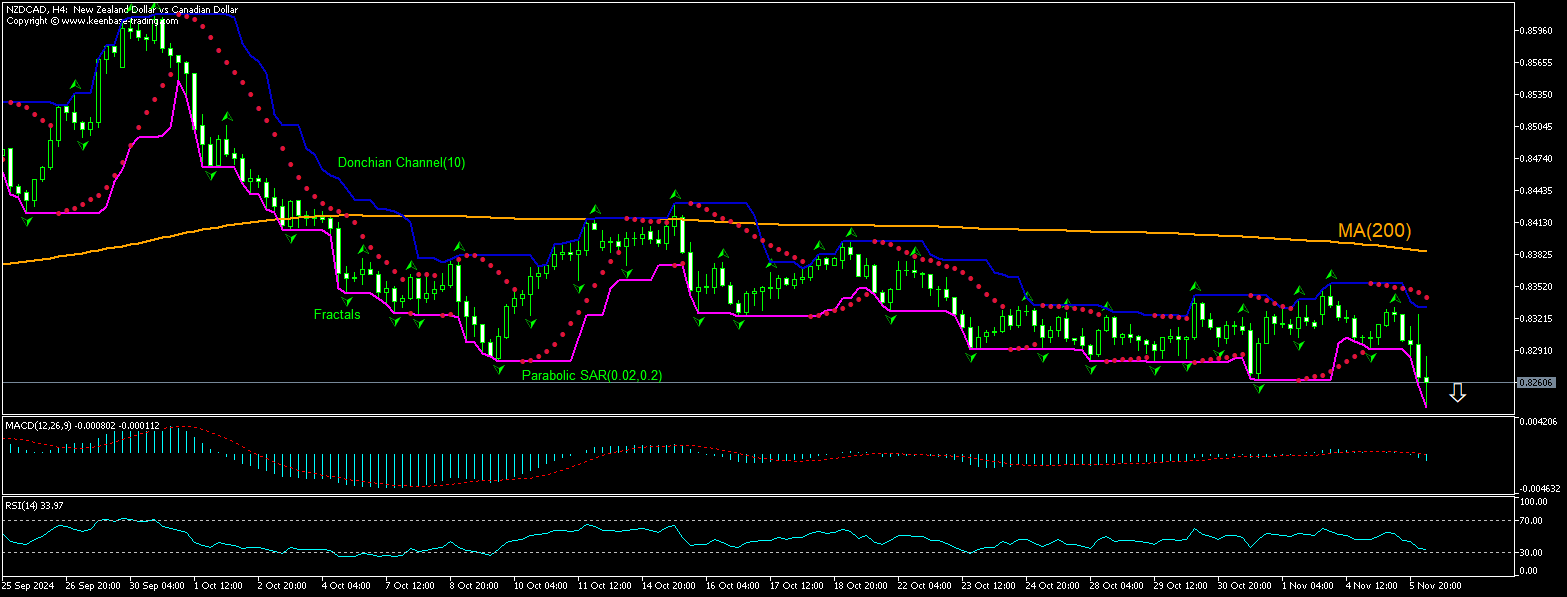
NZD/CAD Графический анализ
NZD/CAD Технический анализ
The technical analysis of the NZDCAD price chart on 4-hour timeframe shows NZDUSD,H4 is declining under the 200-period moving average MA(200) which is declining itself. We believe the bearish momentum will continue after the price breaches below the lower bound of the Donchian channel at 0.82367. A level below this can be used as an entry point for placing a pending order to sell. The stop loss can be placed above 0.83319. After placing the order, the stop loss is to be moved to the next fractal high indicator, following Parabolic signals. Thus, we are changing the expected profit/loss ratio to the breakeven point. If the price meets the stop loss level without reaching the order, we recommend cancelling the order: the market has undergone internal changes which were not taken into account.
Фундаментальный Анализ Форекс - NZD/CAD
New Zealand’s unemployment rose less than expected while Canada’s services sector resumed growing. Will the NZDCAD price retreating persist?
New Zealand’s unemployment rose to 4.8% in the third quarter from 4.6% the previous quarter when an increase to 5% was expected. The annual wage inflation slowed for a sixth straight quarter. Smaller than expected rise in New Zealand unemployment is bullish for the New Zealand dollar and NZDCAD pair. At the same time the S&P Global reported Canada’s services activity returned to growth in October: Canada Services PMI rose to 50.4 in October 2024, up from 46.4 in September. It is the first expansion in the services sector in five months. New business volumes rose driven by improving market demand. Employment rose for the first time in three months. Resumption of growth in Canadian services sector is bullish for Canadian dollar and bearish for NZDCAD currency pair.
Примечание:
Этот обзор носит исключительно информационно-познавательный характер и публикуется бесплатно. Все данные, содержащиеся в обзоре, получены из открытых источников, признаваемых более-менее достоверными. При этом не существует никаких гарантий, что указанная информация является полной и точной. В дальнейшем обзоры не обновляются. Вся информация в каждом обзоре, включая мнения, показатели, графики и всё остальное, предоставлена только в целях ознакомления, и не является финансовым советом или рекомендацией. Весь текст и его любую часть, а также графики нельзя рассматривать в качестве предложения совершать какие-либо сделки с любыми активами. Компания IFC Markets и её сотрудники ни при каких обстоятельствах не несут никакой ответственности за любые действия предпринятые кем бы то ни было после или в ходе ознакомления с обзором.


