アドバイザーの作り方 | IFCM ジャパン
IFC MarketsオンラインCFDブローカー

アドバイザーの作り方

はじめに

この記事は、NTL+言語を使って、アドバイザーを作成するための原理を説明することを目的とします。


アドバイザーを作成する時、アドバイザーのバッファに書いてある価格の計算と表示式を設定することが必要となります。


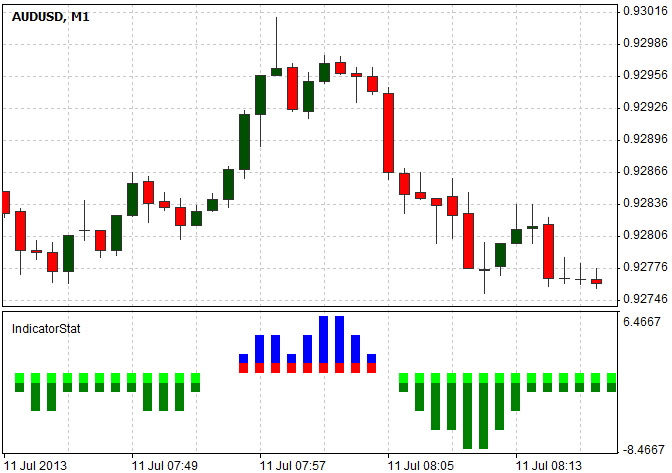
例えば、終値が始値より高いバーと終値が始値より低いバーの間の差分を表示されるアドバイザーを作りましょう。この差は最後 n 間隔の差となります。アドバイザーは、別のウィンドウでヒストグラムとして作成しましょう。


スクリプトコードの書き方

このアルゴリズムが簡単で、アドバイザーの操作を確認しやすくなります。各 i バーは、前の n バーの価格を分析します。上げバーがあると、1が追加され、下げバーがあると、1が差し引られています。
img

アドバイザーのコード


まず、アドバイザーの変数のパラメーターを設定します。

#set_indicator_separate
double ExtMapBuffer1[];
int ExtCountedBars=0;
extern int period = 10;

#set_indicator_separateは、アドバイザーのチャートを別のウインドウに表示させるコマンドです。 ExtMapBuffer1は、アドバイザーの価格のあるグローバル配列です。配列のサイズを設定する必要がありません。


ExtMapBuffer1の配列は、アドバイザー価格のバッファの数があります。ExtCountedBars変数の価格はゼロとなります。この変数は計算されたバーの数があります。以下は、間隔の数が計算されるperiodの変数があります。extern修飾子を使うと、periodの価格を変更することが出来ます。


アドバイザーのベース設定があるInitialize()機能:


int Initialize() { Indicator.SetIndexCount(1); Indicator.SetIndexBuffer(0,ExtMapBuffer1); Indicator.SetIndexStyle(0,ltHistogram,lsSolid,5,clrBlue); return(0); }

アドバイザーのSetIndexCount法は、アドバイザーの価格のバッファ数を設定されています。ExtMapBuffer1バッファは1つで、パーラーメーターに1を設定しましょう。バッファの番号と配列の組み合わせを作るため、Indicator.SetIndexBuffer(0,ExtMapBuffer1)を入力することが必要となります。


次のラインは、アドバイザーのパーラーメーターを設定しましょう。SetIndexStyle法の1つのパーラーメーターは、バッファの番号を設定されている。 SetIndexBufferに指摘した価格はゼロとなります。2つのパーラーメーターは表示のタイプで、ヒストグラムになります。3つのパーラーメーターは、ラインのスタイルをlsSolidとして設定しましょう。その後、ラインの厚さは5となり、色はclrBlue(RGBフォーマットもいい、例えば、0x0000FF)となります。


Run()の機能はdraw()のユーザー機能をスタートされています。draw()は計算を全部行われています。


int Run() { ExtCountedBars=Indicator.Calculated; if (ExtCountedBars < 0) { System.Print("Error"); return(-1); } draw(); return(0); }

ExtCountedBars変数は変更されなかったバーの数があります。 ExtCountedBars < 0だと、アドバイザーの起動は停止されています。draw()機能は、価格を計算され、価格をバッファに移動されています。


void draw() { int pos=Chart.Bars-ExtCountedBars-1; int value; while(pos>=0) { value=0; for(int i=pos;i < pos+period && i < Chart.Bars-1;i++) { if(Open[i] < Close[i]) value+=1; else value-=1; } ExtMapBuffer1[pos]=value; pos--; } }

ライン«int pos=Chart.Bars-ExtCountedBars-1;»は、計算開始のデータを設定しましょう。Chart.Barsは、最も遠く要素はChart.Bars-1で、Chart.Bars-ExtCountedBars-1となります。value変数は、データ収集のために使います。後、各バーのChart.Bars-ExtCountedBars-1から0まで前のperiodデータが収集されています。


Соберем весь код воедино:


#set_indicator_separate double ExtMapBuffer1[]; int ExtCountedBars=0; extern int period = 10; int Initialize() { Indicator.SetIndexCount(1); Indicator.SetIndexBuffer(0,ExtMapBuffer1); Indicator.SetIndexStyle(0,ltHistogram,lsDot,5,clrBlue); return(0); } int Run() { ExtCountedBars=Indicator.Calculated; if (ExtCountedBars < 0) { System.Print("Error"); return(-1); } draw(); System.Print("ExtCountedBars="+ExtCountedBars); return(0); } void draw() { int pos=Chart.Bars-ExtCountedBars-1; int value; while(pos>=0) { value=0; for(int i=pos;i < pos+period && i < Chart.Bars-1;i++) { if(Open[i] < Close[i]) value+=1; else value-=1; } ExtMapBuffer1[pos]=value; pos--; } }

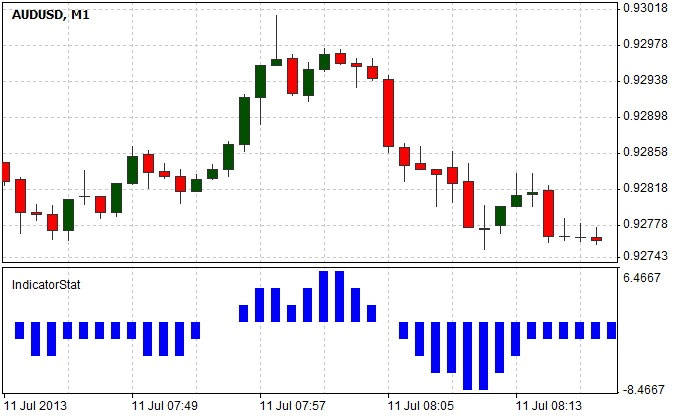
アドバイザーをわずかに改善しましょう。下向きバーを赤にして、上向きバーを緑にしましょう。


#set_indicator_separate double ExtMapBuffer1[]; double ExtMapBuffer2[]; double ExtMapBuffer3[]; double ExtMapBuffer4[]; int ExtCountedBars=0; extern int period = 10; int Initialize() { Indicator.SetIndexCount(4); Indicator.SetIndexBuffer(0,ExtMapBuffer1); Indicator.SetIndexStyle(0,ltHistogram,lsDot,5,clrBlue); Indicator.SetIndexBuffer(1,ExtMapBuffer2); Indicator.SetIndexStyle(1,ltHistogram,lsDot,5,clrGreen); Indicator.SetIndexBuffer(2,ExtMapBuffer3); Indicator.SetIndexStyle(2,ltHistogram,lsDot,5,clrRed); Indicator.SetIndexBuffer(3,ExtMapBuffer4); Indicator.SetIndexStyle(3,ltHistogram,lsDot,5,clrLime); return(0); } int Run() { ExtCountedBars=Indicator.Calculated; if (ExtCountedBars < 0) { System.Print("Error"); return(-1); } draw(); return(0); } void draw() { int pos=Chart.Bars-ExtCountedBars-1; int value; while(pos>=0) { value=0; for(int i=pos;i < pos+period && i < Chart.Bars-1;i++) { if(Open[i] < Close[i]) value+=1; else value-=1; } if(value>0) { ExtMapBuffer1[pos]=value; ExtMapBuffer2[pos]=0; ExtMapBuffer3[pos]=1; ExtMapBuffer4[pos]=0; } if(value==0) { ExtMapBuffer1[pos]=0; ExtMapBuffer2[pos]=0; ExtMapBuffer3[pos]=0; ExtMapBuffer4[pos]=0; } if(value < 0) { ExtMapBuffer1[pos]=0; ExtMapBuffer2[pos]=value; ExtMapBuffer3[pos]=0; ExtMapBuffer4[pos]=-1; } } pos--; } }

2つの色のあるアドバイザーの画像:

img

アドバイザーを作るとき、以下のエラーが出るのは可能となります:"run function call failed"(run機能発生エラー)。エラーが出ると、配列の価格を改訂して下さい。


概要

この記事は、アドバイザーはステップバイステップで作られています。アドバイザーの作り方は、NTL+のスクリプトを理解するため実装されていました。

Close support
Call to Skype Call Back