- Analisi
- Analisi Tecnica
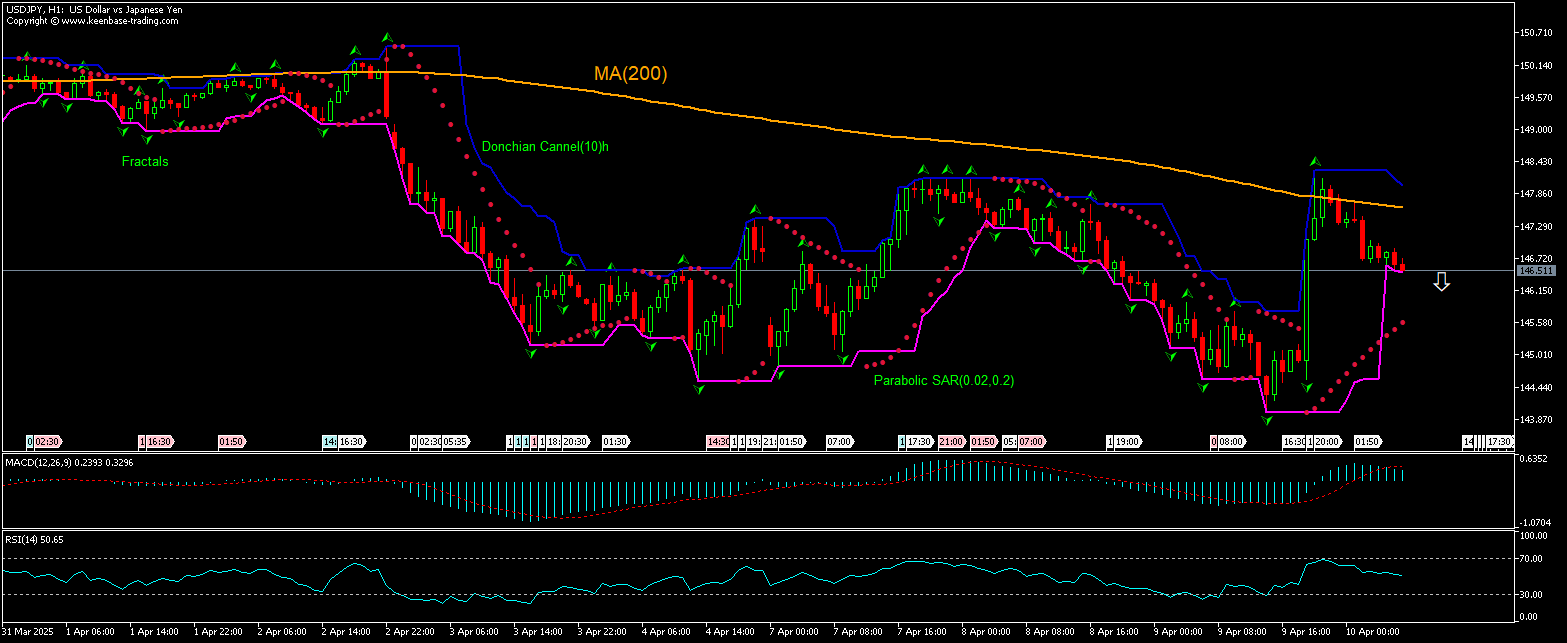
USD JPY Analisi Tecnica - USD JPY Trading: 2025-04-10
Dollaro Yen Technical Analysis Summary
Sotto 146.443
Sell Stop
Sopra 147.613
Stop Loss
| Indicator | Signal |
| RSI | Neutro |
| MACD | Sell |
| MA(200) | Sell |
| Fractals | Sell |
| Parabolic SAR | Buy |
| Donchian Channel | Sell |
Dollaro Yen Chart Analysis
Dollaro Yen Analisi Tecnica
The technical analysis of the USDJPY price chart on 1-hour timeframe shows USDJPY,H1 is retreating after unsuccessful test of the 200-period moving average MA(200) yesterday. We believe the bearish movement will continue after the price breaches below the lower bound of the Donchian channel at 146.443. A level below this can be used as an entry point for placing a pending order to sell. The stop loss can be placed above 147.613. After placing the order, the stop loss is to be moved to the next fractal high , following Parabolic indicator signals. Thus, we are changing the expected profit/loss ratio to the breakeven point. If the price meets the stop loss level without reaching the order, we recommend cancelling the order: the market has undergone internal changes which were not taken into account.
Analisi Fondamentale Forex - Dollaro Yen
Japan’s producer prices inflation accelerated in March. Will the USDJPY price decline?
Japan’s producer prices inflation accelerated in March: the Bank of Japan reported Japan's Producer Price Index (PPI) growth ticked up to 4.2% over year in March after 4.1% growth in February, when a decline to 3.9% rate was expected. It was the 49th straight month of producer inflation, with prices rising further for most components led by non-ferrous metals (12.3% vs 13.4%), and petroleum and coal (8.6% vs 5.9% and 4.7%). Producer prices grew by 0.4% over month, accelerating from 0.2% increase in February and marking the steepest rise in three months. Higher than expected Japan’s producer prices inflation is bullish for yen and bearish for USDJPY currency pair.
Note:
Questa panormaica è di carattere informativo-educativo e viene pubblicata gratuitamente. Tutti i dati compresi nella panoramica sono ottenuti da fonti pubbliche conosciute più o meno affidabili. Inoltre non c'è alcuna garanzia che le informazioni fornite siano precise e complete. Le panoramiche non vengono aggiornate. Tutta l'informazione in ciascuna panoramica, compresi indicatori, opinioni, grafici e o quant'altro, è fornita a scopo conoscitivo e non è un consiglio finanziario. Tutto il testo e qualsiasi delle sue parti, e anche i grafici non possono essere considerati un'offerta per effettuare un'operazione con un qualsiasi asset. IFC Markets e i suoi impiegati in alcun caso non sono responsabili per qualsiasi azione intrapresa sulla base delle informazioni contenute.


