- Innovazioni
- Articoli sull'applicazione di PCI
- Trading di Spread
PCI on Agricultural Futures: Wheat Futures and Feeder Cattle
Today we want to bring to your attention another synthetic instrument, implemented in NetTradeX trading terminal. This time let us use trading instruments of ''Commodities'' section. We take two agricultural futures: frozen cattle and wheat, creating the following type of PCI: Wheat/F-cattle. This means that we will have wheat in the base part and frozen cattle in the quoted part. We will study the basic tendencies in the dynamics of demand and supply for both products.
Wheat
According to the forecasts by Food and Agriculture Organization (FAO), global grain consumption for 2013/14 will increase by 4% or by 92 million tons, as compared to 2012/13, and will be 2 415 million tons. As expected, the main growth will be due to forage crops. Its consumption will increase by 8% or by 52 million tons and will be 708 million tons. Food consumption of grains will be 1 094 million tons. This is only by 1,7% more than in the previous season. The major part of even so modest growth will be due to rice. Practically, the food consumption of the wheat will not change.
Source: FAO data
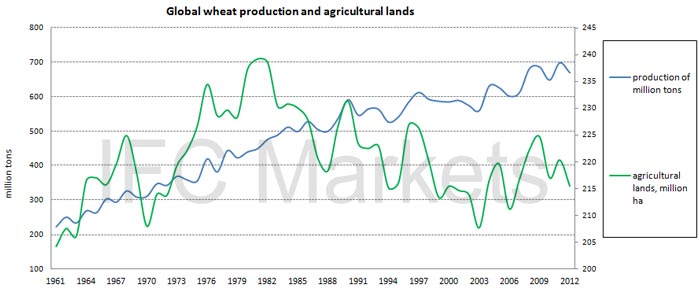
As it is seen on the presented graph, the global wheat production has increased steadily due to productivity growth and contemporary agricultural engineering. Since the beginning of 60s it has increased by 3,5 times. The number of agricultural lands reached their maximum in 1981 and is gradually reducing since then. During the last five years the growth of the global wheat production has stagnated at the level of 700 million tons, which is slightly less than one third of the total grain production in the world. In our view, this is due to the stabilization of wheat consumption in developed countries at approximately 80kg per person a year.
According to FAO forecasts, the volume of global crop trading in 2013/14 will increase by 4% or by 12 million tons, as compared to 2012/13, and will be 321,4 million tons. It may be due to the increased exports from European Union and Canada. The growth of global wheat trading will be less by 2,5% and will be 143,5 million tons. As expected, the volume of forage grain trading will grow by 5,5% and will be 139,5 million tons. This is a new absolute record in the history.
We suppose that the increase of forage grain shares in its overall production will contribute to the increase of F-cattle meat production.
The growth of world wheat export volumes in monetary terms is far ahead of the respective figure in kind. This is due to rising prices.
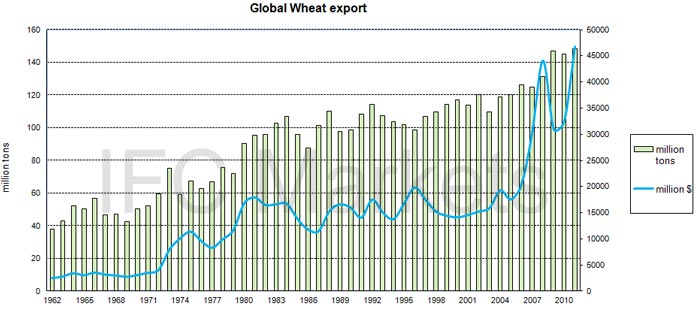
In its agricultural forecast up to 2023, U.S. Department of Agriculture is expecting the volume of global wheat trading to increase by 19% (28 million tons) up to 177,5 million for the period from 2014/15 to 2023/24. Major consumers will be developing countries of Africa and Southeast Asia, Near East, India and Pakistan. Major wheat providers (60%) to the global market are the USA, Canada, Australia, European Union and Argentina. Note that in the next 10 years USDA does not expect a significant reduction in world wheat prices.
Organization for Economic Co-operation and Development (OECD) and FAO have presented their joint agricultural forecast for 2013 – 2022. Global wheat production is expected to increase by 12,5% to 784,5 million tons by 2022. The volume of global trading will increase by 11,4%. OECD – FAO forecasts that in 2022 world wheat prices will be by 9% lower, than in 2013.
Here we would like to draw your attention to the fact that while using PCI it is not necessary to strictly predict the prices of the selected assets in the future. It is enough to identify tendencies in the dynamics of two assets, relative to each other. The general movement of the market is not so important. Based on the long-term overviews of wheat, we conclude that it will be in stable demand in the future. Any considerable increase in global wheat production is not expected. As for the main tendencies of this year, we want to note that due to extremely cold winter in the USA, the winter wheat harvest is expected to decrease to 30% on separate species. This may cause a noticeable price increase.
F-cattle
This year over 67 million tons of Feeder cattle meat can be produced in the world. Global cattle production noticeably yields to wheat in terms of growth rates. From the beginning of 60s it has increased only by 2,3 times. We suppose that this is because of the USA, where the growth was over 50% from 1961 to 2013. A significant part of pastures was reorientated under cultivation of crops for biofuel production. As a result, at the beginning of the previous year the U.S. cattle totaled 89,3 million head. This is the minimum amount since 1952.
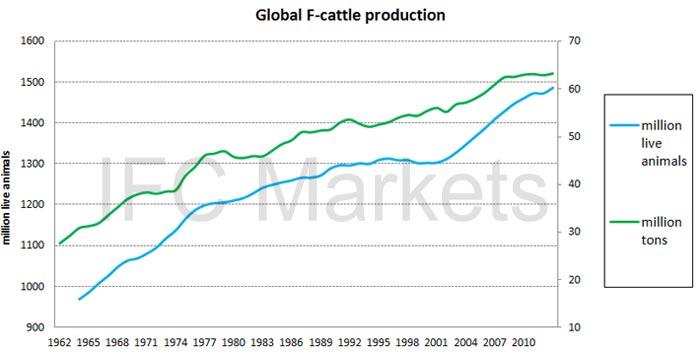
The major producers and exporters of F-cattle are Canada, Australia, Brazil, Mexico and Argentina. The major consumers and importers are China, Japan, South Korea, developing countries. Note, that the USA, Japan and China have recently reduced restrictions to import F-cattle to their countries. This may promote the profitability of farmers from European Union and Australia. The USA is one of the largest F-cattle producers in the world. In spite of it, the country has become a net importer for already a long time.
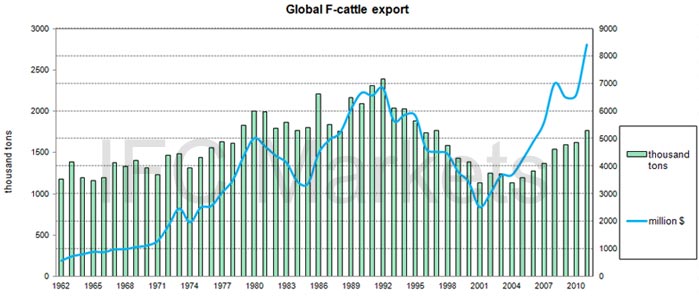
As can be seen from the graph, The growth of world export volumes in monetary terms is far ahead of the respective figure in kind. Like in case of wheat, it is due to price growth. From the beginning of 60s of the past century the wheat export has increased by 18,5 times in monetary terms, the F-cattle export – by only 15 times. In the respective figure in kind the wheat export has increased by 3,9 times, the F-cattle export – by only 50. We believe that the price growth in meat has been too high in recent years and we do not exclude a downward correction. According to OECD – FAO forecasts, by 2022 the volume of F-cattle world export and production will rise by 14%. This is more than corresponding wheat indicators.
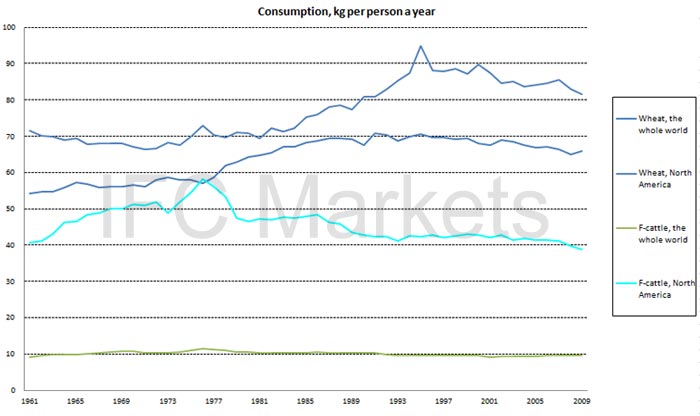
Let us compare wheat consumption with F-cattle consumption. We have chosen North America as an example of a developed country. The wheat consumption there has reached its highest in 1995 – 95 kg a year. Since then it has decreased by 14%. The difference between wheat consumption in North America and all over the world is now 23,6%, as F-cattle is used approximately four times more in North America, than the global average. We suppose the F-cattle consumption to grow due to the demand of developing countries, but now it is prevented by high value. Furthermore, the situation is not so good in North America, as well. According to forecasts, due to price increase in F-cattle meat, its annual consumption in 2014 may decrease up to the level of 70s per person. We do not rule out that it may cause resentment of the US population and accordingly, decrease in F-cattle prices. In the USA the sales of McDonalds decreased by 1.4% in December 2013 compared with December 2012, the first time since the crisis of 2008.
Wheat value may rise due to its increased use as feed for livestock and poultry. One cow takes 4-6 kg of grains per day in the breeding period. And it should be taken into account that corn takes more than 60% of feed grains in the world, as it is cheaper than wheat by about a third and is used in fattening bulls. Herewith, the share of animal feeds is 20%-45% of the total energy nutritional diet of F-cattle. In the feed of cows and calves the wheat share is quite considerable in the stall period and reaches 30%. In Russia and other countries, where no crop is growing, share of wheat in animal feed for cattle reaches 40%.
Recently, F-cattle prices have significantly increased, and wheat prices have fallen. In our opinion, this can encourage farmers to spend more and more of the wheat harvest for cattle feed. In that case the cost of grain will start to increase, and that of meat to decline.
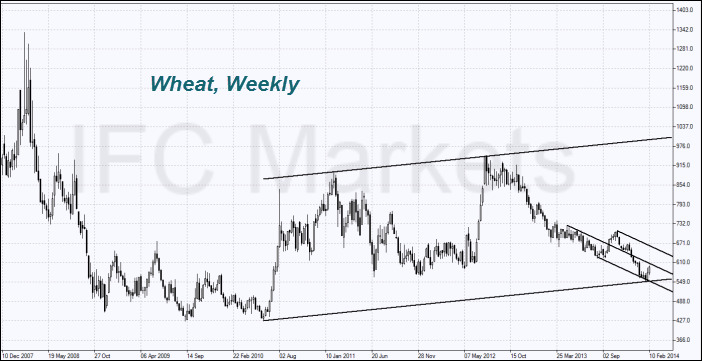
Now let us build a weekly chart of the frozen cattle.
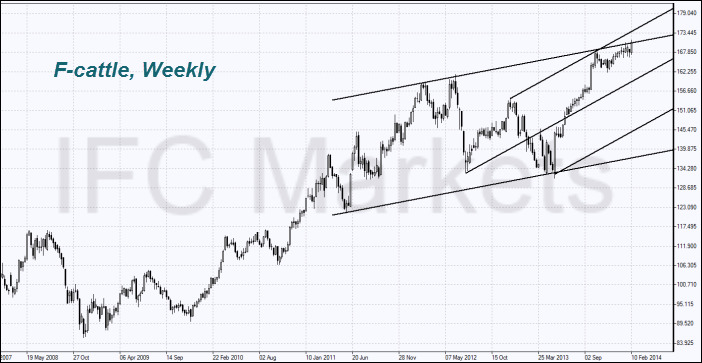
Assume that F-cattle prices have reached the upper boundary of the trading range on the weekly chart.
Now let us build PCI Wheat / F-cattle.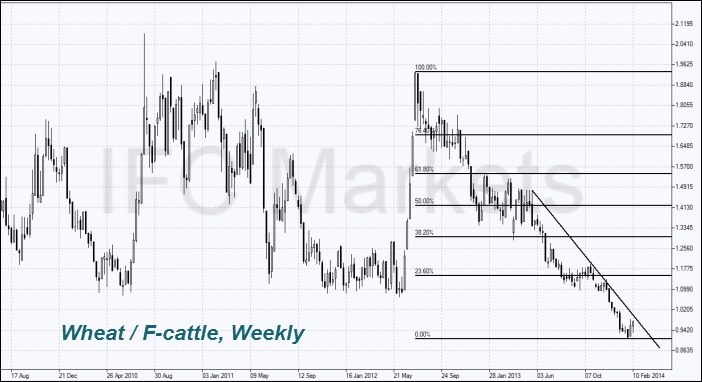
Practically, this is the idea of creating PCI Wheat / F-cattle. We expect that futures on frozen cattle will increase in price more slowly and decrease more quickly, as compared to wheat futures. Under these conditions, the composite instrument Wheat / F-cattle will reverse up and will be in a growing trend. In order to get trading signals using its chart, you should use methods of technical analysis.
Questions and suggestions:analytics@ifcmarkets.comArticoli precedenti
- Performance of Japanese stock market versus the US stock market
- Comparing the performance of German stock market versus US stock market
- Arbitrage Trading | FCATTLE/SOYB - The Efficiency Analysis
- PCI: Commodity Futures - Coffee vs Cocoa
- New Corporate Report - Google Stocks, Apple Stocks
- Spread Trading | Stock Trading - Google Stocks, Apple Stocks
