- 분석
- 기술적 분석
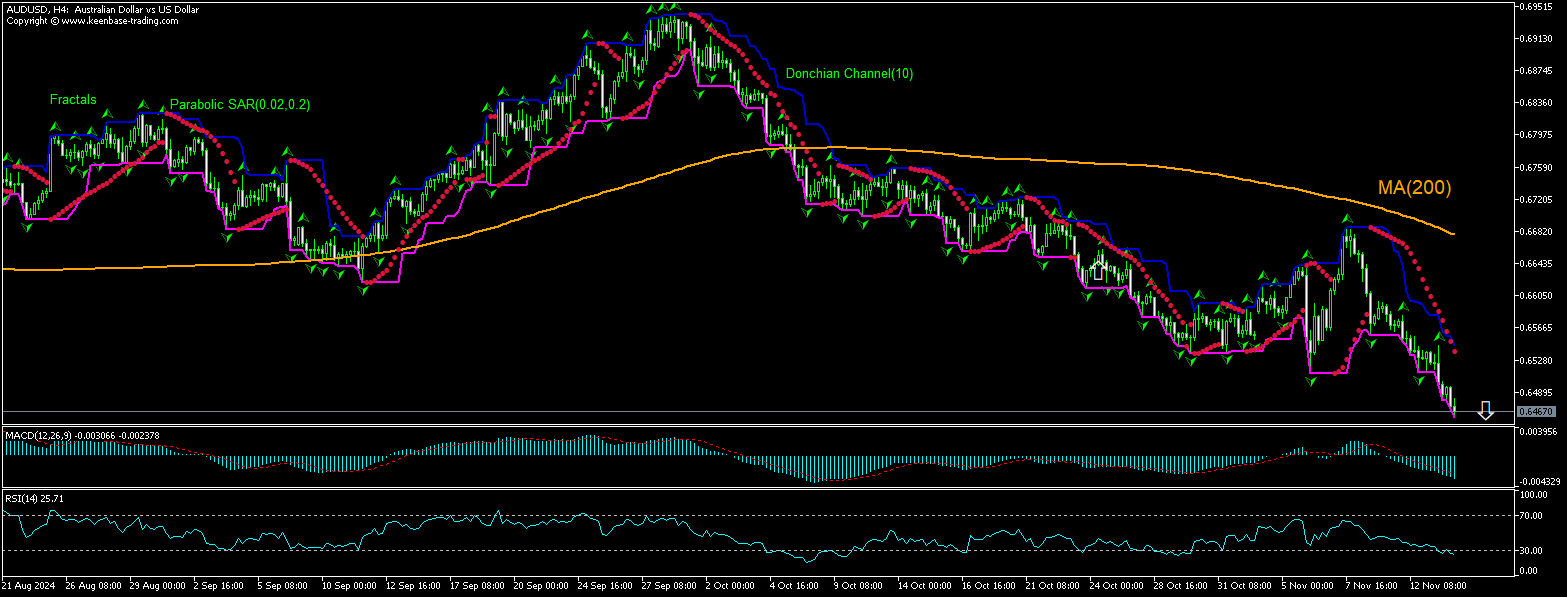
AUD USD 기술적 분석 - AUD USD 거래: 2024-11-14
AUD/USD 기술적 분석 요약
아래에 0.6459
Sell Stop
위에 0.6537
Stop Loss
| 인디케이터 | 신호 |
| RSI | 구매 |
| MACD | 판매 |
| Donchian Channel | 판매 |
| MA(200) | 판매 |
| Fractals | 판매 |
| Parabolic SAR | 판매 |
AUD/USD 차트 분석
AUD/USD 기술적 분석
The technical analysis of the AUDUSD price chart on 4-hour timeframe shows AUDUSD,H4 is retracing down after rebounding to test the 200-period moving average MA(200) a week ago. RSI is in oversold zone. We believe the bearish movement will continue after the price breaches below the lower bound of the Donchian channel at 0.6459. A level below this can be used as an entry point for placing a pending order to sell. The stop loss can be placed above 0.6537. After placing the order, the stop loss is to be moved to the next fractal high indicator, following Parabolic signals. Thus, we are changing the expected profit/loss ratio to the breakeven point. If the price meets the stop loss level without reaching the order, we recommend cancelling the order: the market has undergone internal changes which were not taken into account.
Forex - AUD/USD 기본 분석
Australia’s employment report came in mixed for October. Will the AUDUSD price retreating persist?
Australia’s labor market data were mixed for October: the Australian Bureau of Statistics reported the unemployment rate remained steady at 4.1% in October, in line with expectation. However, the number of employed people during the previous month rose by 15.9 thousand after increasing by 61.3 thousand in September when an increase by 25.2 thousand was expected. Full-time employment rose by 9.7 thousand, much softer than a downwardly revised 48.8 thousand surge in September. At the same time, part-time employment added 6.2 thousand, down sharply from September's 12.5 thousand. Through the year to October, employment increased by 387.1 thousand or 2.7%. The current setup is bearish for AUDUSD despite unemployment rate remaining steady for third month.
Note:
해당 개요는 유익하고 튜토리얼적인 성격을 가지고 있으며 무료로 게시됩니다. 이 개요에 포함된 모든 데이터는 어느 정도 신뢰할 수 있는 것으로 간주되는 오픈 소스에서 받은 것입니다. 또한 표시된 정보가 완전하고 정확하다는 보장이 없습니다. 개요가 업데이트되지 않습니다. 의견, 인디케이터, 차트 및 기타 항목을 포함하여 각 개요의 전체 정보는 이해의 목적으로만 제공되며 재정적 조언이나 권장 사항이 아닙니다. 전체 텍스트와 그 일부, 차트는 자산과의 거래 제안으로 간주될 수 없습니다. IFC Markets와 그 직원은 어떤 상황에서도 개요를 읽는 동안 또는 읽은 후에 다른 사람이 취한 행동에 대해 책임을 지지 않습니다.


