- تجزیه و تحلیل
- تحلیل تکنیکی
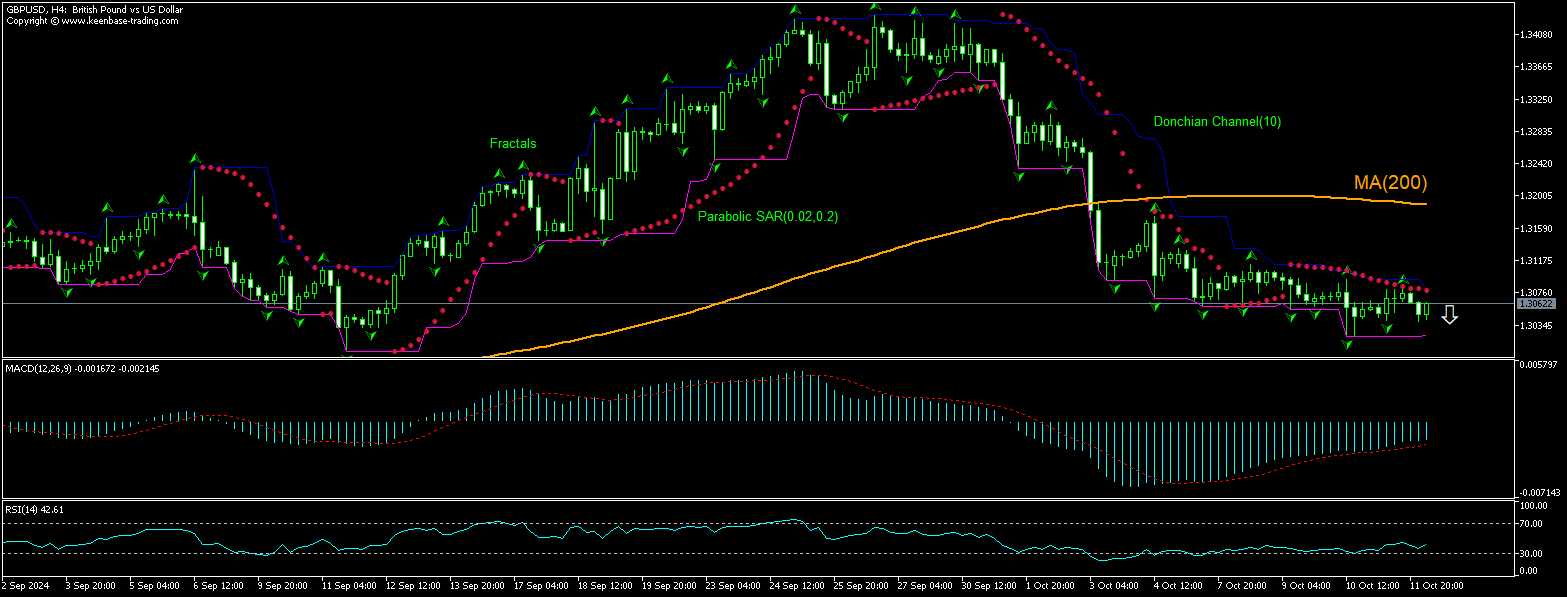
GBP/USD تحلیل تکنیکی - GBP/USD معامله: 2024-10-14
GBP/USD خلاصۀ تحلیل تکنیکی
پایین 1.30195
Sell Stop
بالای 1.30821
Stop Loss
| اندیکاتور | سیگنال |
| RSI | خنثی |
| MACD | خنثی |
| Donchian Channel | فروش |
| MA(200) | فروش |
| Fractals | خنثی |
| Parabolic SAR | فروش |
GBP/USD تحلیل نمودار
GBP/USD تحلیل تکنیکی
The technical analysis of the GBPUSD price chart on 4-hour timeframe shows GBPUSD, H4 is trading in a range under the 200-period moving average MA(200) after returning below MA(200) ten days ago. We believe a bearish movement will resume after the price breaches below the lower bound of the Donchian channel at 1.30195 A level below this can be used as an entry point for placing a pending order to sell. The stop loss can be placed above 1.30821. After placing the order, the stop loss is to be moved to the next fractal high indicator, following Parabolic signals. Thus, we are changing the expected profit/loss ratio to the breakeven point. If the price meets the stop loss level without reaching the order, we recommend cancelling the order: the market has undergone internal changes which were not taken into account.
تحلیل بنیادی فارکس - GBP/USD
UK’s gross domestic product (GDP) grew in August in line with expectations. Will the GBPUSD price retreating reverse?
UK’s gross domestic product (GDP) grew in August: the Office for National Statistics reported UK GDP grew 0.2% over month after no change in July. Services output grew by 0.1% in August while production output grew by 0.5% and construction output rose by 0.4%. GDP is estimated to have increased by 1.0% in August compared with the same month last year. Resumption of growth of UK economy is bullish for Pound and GBPUSD pair. However, the current setup is bearish for the pair.
توجه:
این بررسی صرفاً جنبۀ آموزشی و اطلاع رسانی دارد که بطور رایگان منتشر می شود. همۀ آمار مندرج در این بررسی از منابع عمومی دریافت شده و کم و بیش معتبر می باشند. ضمن اینکه هیچ تضمینی وجود ندارد که اطلاعات ارائه شده دقیق و کامل باشند. بررسی ها به روزرسانی نشده اند. همۀ اطلاعات مندرج در بررسی ها از جمله اظهار نظرها، شاخص ها، نمودارها و غیره صرفاً به منظور آشنایی ارائه می شوند و یک توصیه مالی یا یک پیشنهاد نمی باشند. همۀ متن بررسی یا هر بخشی از متن از جمله نمودارها نباید به عنوان یک پیشنهاد برای انجام معامله با دارائی خاصی مورد استفاده قرار گیرند. شرکت IFC Markets و کارکنانش تحت هیچ شرایطی مسئولیتی در قبال هرگونه اقدامی که هر فردی در حین یا پس از مطالعۀ بررسی انجام می دهد برعهده ندارند.


