- تجزیه و تحلیل
- تحلیل تکنیکی
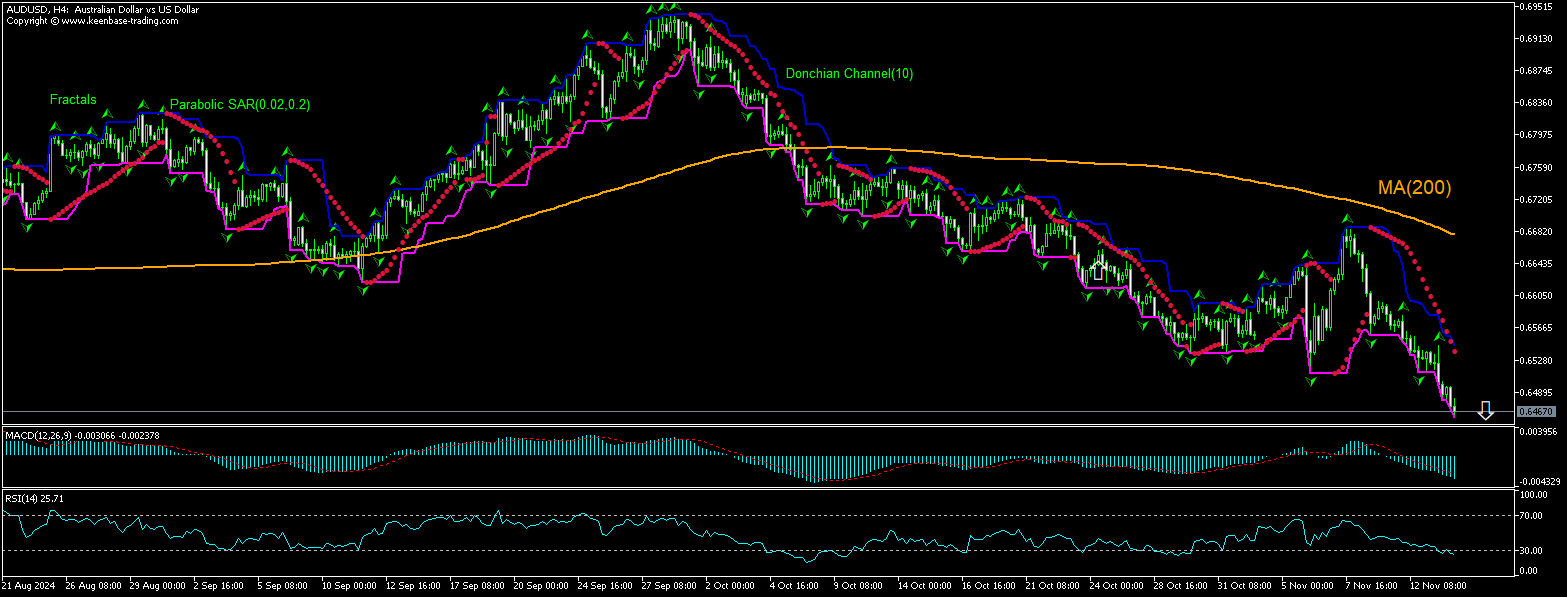
AUD/USD تحلیل تکنیکی - AUD/USD معامله: 2024-11-14
AUD/USD خلاصۀ تحلیل تکنیکی
پایین 0.6459
Sell Stop
بالای 0.6537
Stop Loss
| اندیکاتور | سیگنال |
| RSI | خرید |
| MACD | فروش |
| Donchian Channel | فروش |
| MA(200) | فروش |
| Fractals | فروش |
| Parabolic SAR | فروش |
AUD/USD تحلیل نمودار
AUD/USD تحلیل تکنیکی
The technical analysis of the AUDUSD price chart on 4-hour timeframe shows AUDUSD,H4 is retracing down after rebounding to test the 200-period moving average MA(200) a week ago. RSI is in oversold zone. We believe the bearish movement will continue after the price breaches below the lower bound of the Donchian channel at 0.6459. A level below this can be used as an entry point for placing a pending order to sell. The stop loss can be placed above 0.6537. After placing the order, the stop loss is to be moved to the next fractal high indicator, following Parabolic signals. Thus, we are changing the expected profit/loss ratio to the breakeven point. If the price meets the stop loss level without reaching the order, we recommend cancelling the order: the market has undergone internal changes which were not taken into account.
تحلیل بنیادی فارکس - AUD/USD
Australia’s employment report came in mixed for October. Will the AUDUSD price retreating persist?
Australia’s labor market data were mixed for October: the Australian Bureau of Statistics reported the unemployment rate remained steady at 4.1% in October, in line with expectation. However, the number of employed people during the previous month rose by 15.9 thousand after increasing by 61.3 thousand in September when an increase by 25.2 thousand was expected. Full-time employment rose by 9.7 thousand, much softer than a downwardly revised 48.8 thousand surge in September. At the same time, part-time employment added 6.2 thousand, down sharply from September's 12.5 thousand. Through the year to October, employment increased by 387.1 thousand or 2.7%. The current setup is bearish for AUDUSD despite unemployment rate remaining steady for third month.
توجه:
این بررسی صرفاً جنبۀ آموزشی و اطلاع رسانی دارد که بطور رایگان منتشر می شود. همۀ آمار مندرج در این بررسی از منابع عمومی دریافت شده و کم و بیش معتبر می باشند. ضمن اینکه هیچ تضمینی وجود ندارد که اطلاعات ارائه شده دقیق و کامل باشند. بررسی ها به روزرسانی نشده اند. همۀ اطلاعات مندرج در بررسی ها از جمله اظهار نظرها، شاخص ها، نمودارها و غیره صرفاً به منظور آشنایی ارائه می شوند و یک توصیه مالی یا یک پیشنهاد نمی باشند. همۀ متن بررسی یا هر بخشی از متن از جمله نمودارها نباید به عنوان یک پیشنهاد برای انجام معامله با دارائی خاصی مورد استفاده قرار گیرند. شرکت IFC Markets و کارکنانش تحت هیچ شرایطی مسئولیتی در قبال هرگونه اقدامی که هر فردی در حین یا پس از مطالعۀ بررسی انجام می دهد برعهده ندارند.


