- Phân tích dữ liệu
- Phân tích kỹ thuật thị trường
AUD/USD Phân tích kỹ thuật - AUD/USD Giao dịch: 2024-10-30
AUD/USD Tổng quan phân tích kỹ thuật
Dưới 0.65363
Sell Stop
Trên 0.66034
Stop Loss
| Chỉ thị | Tín hiệu |
| RSI | Mua |
| MACD | Bán |
| Donchian Channel | Bán |
| MA(200) | Bán |
| Fractals | Bán |
| Parabolic SAR | Bán |
AUD/USD Phân tích biểu đồ
AUD/USD Phân tích kỹ thuật
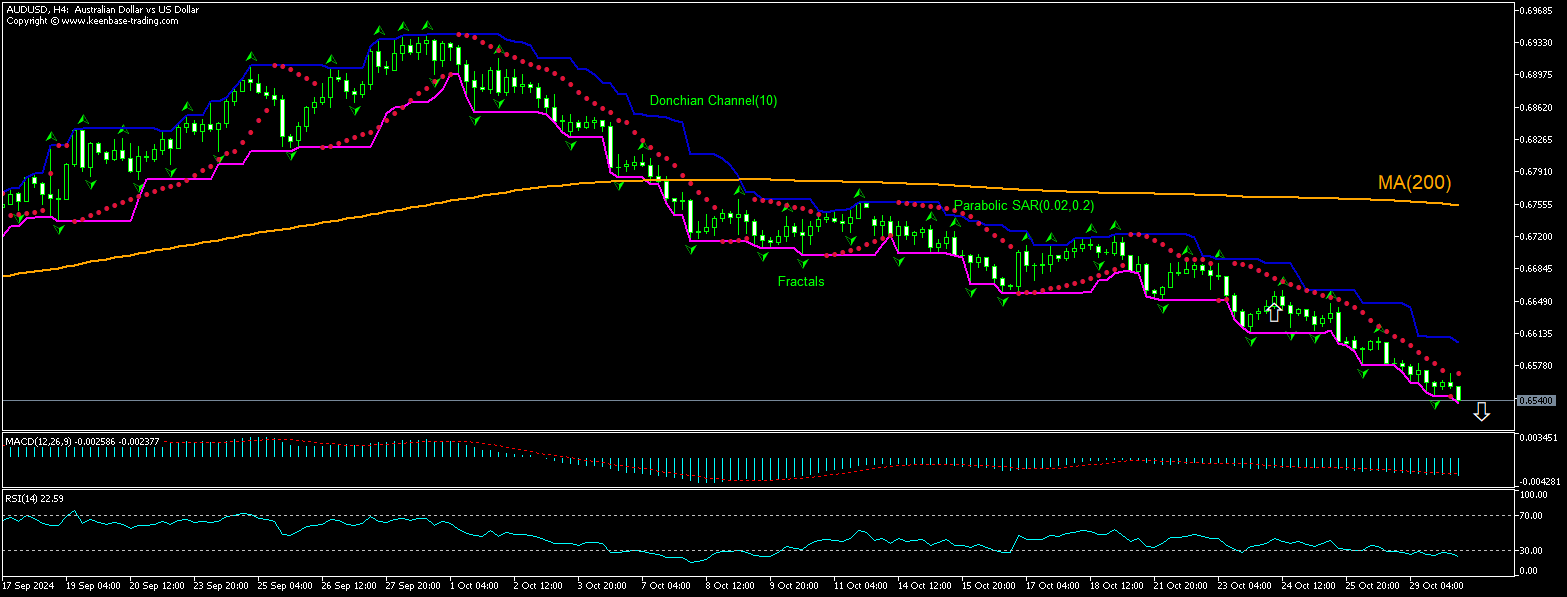
The technical analysis of the AUDUSD price chart on 4-hour timeframe shows AUDUSD,H4 is retracing lower under the 200-period moving average MA(200) which is declining itself. RSI is in oversold zone. We believe the bearish momentum will continue after the price breaches below the lower bound of the Donchian channel at 0.65363. A level below this can be used as an entry point for placing a pending order to sell. The stop loss can be placed above 0.66034. After placing the order, the stop loss is to be moved to the next fractal high indicator, following Parabolic signals. Thus, we are changing the expected profit/loss ratio to the breakeven point. If the price meets the stop loss level without reaching the order, we recommend cancelling the order: the market has undergone internal changes which were not taken into account.
Phân tích vĩ mô Forex - AUD/USD
Australia’s latest inflation data were weaker than expected. Will the AUDUSD price retreating persist?
Australian Bureau of Statistics latest inflation data were weaker than expected: consumer price index growth declined to 2.1% over year in September after 2.7% growth in August when a decline to 2.3% was forecast. The component with highest contribution to price increases was Alcohol and tobacco followed by Food and non-alcoholic beverages, rising 6.3% and 3.3% respectively. The increase in the index excluding volatile items and holiday travel was 2.7% over year in September, down from a 3.0% rise in August. Slower than expected Australian consumer prices inflation is bearish for Australian dollar and hence for AUDUSD pair.
Lưu ý:
Bài tổng quan này mang tính chất tham khảo và được đăng miễn phí. Tất cả các dự liệu trong bài viết được lấy từ các nguồn thông tin mở và được công nhận đang tin cậy. Nhưng không có bất kỳ đảm bảo nào rằng thông tín hoàn toàn đang tin cậy. Sau này không điều chỉnh lại nữa. Tất cả thông tin trong bài tổng quan, bao gồm ý kiến, chỉ số, biểu đồ và khác chỉ mang tính chất tham khảo và không phải là lời khuyên đầu tư. Tất cả bài viết này không được xem xét như lời khuyên thúc đẩy để giao dịch. Công ty IFC Markets và nhân viên không chịu trách nghiệm cho bất kỳ quyết định của khách hàng sau khi đọc xong bài tổng quan.


