- Phân tích dữ liệu
- Phân tích kỹ thuật thị trường
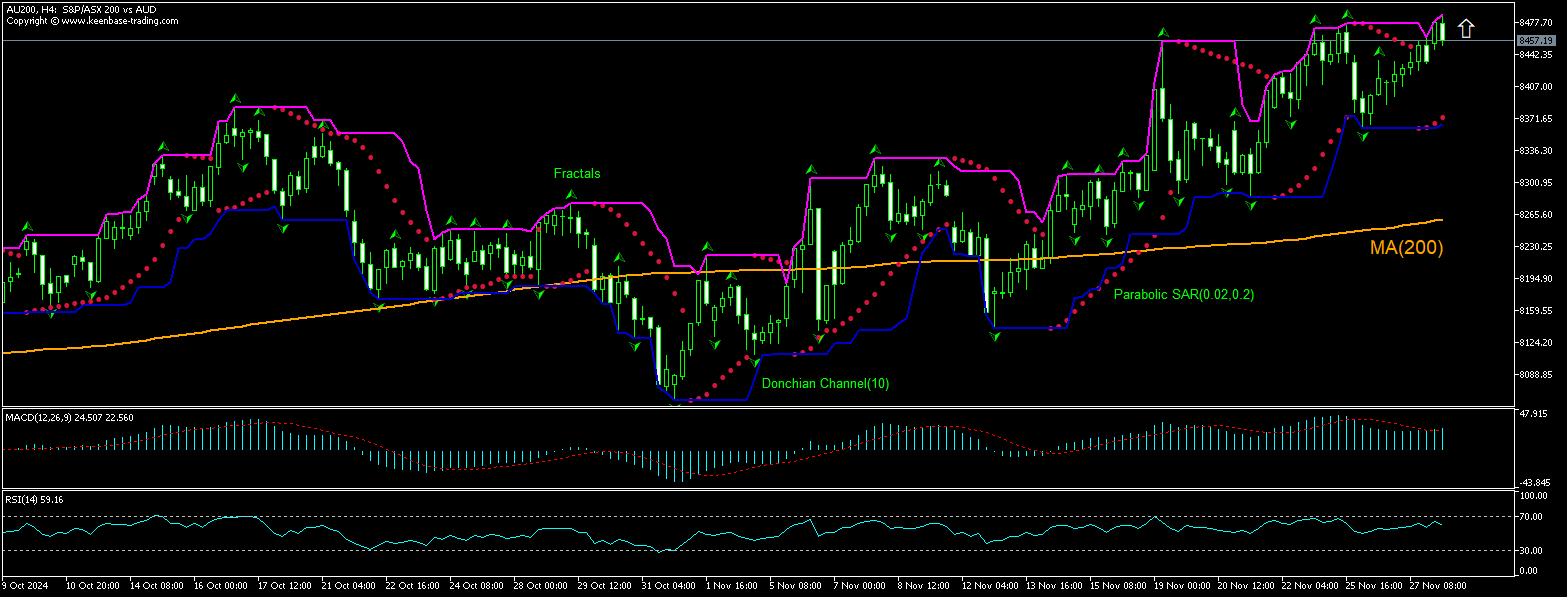
Chỉ số Chứng Khoán Úc Phân tích kỹ thuật - Chỉ số Chứng Khoán Úc Giao dịch: 2024-11-28
Index chứng khoán Úc Tổng quan phân tích kỹ thuật
Trên 8486.36
Buy Stop
Dưới 8387.21
Stop Loss
| Chỉ thị | Tín hiệu |
| RSI | Trung lập |
| MACD | Mua |
| Donchian Channel | Mua |
| MA(200) | Mua |
| Fractals | Mua |
| Parabolic SAR | Mua |
Index chứng khoán Úc Phân tích biểu đồ
Index chứng khoán Úc Phân tích kỹ thuật
The AU200 technical analysis of the price chart on 4-hour timeframe shows AU200,H4 is rebounding above the 200-period moving average MA(200) after pullback following a record close three days ago. We believe the bullish momentum will continue after the price breaches above the upper Donchian boundary at 8486.36. This level can be used as an entry point for placing a pending order to buy. The stop loss can be placed below 8387.21. After placing the pending order the stop loss is to be moved every day to the next fractal low indicator, following Parabolic signals. Thus, we are changing the expected profit/loss ratio to the breakeven point. If the price meets the stop-loss level (8387.21) without reaching the order (8486.36) we recommend cancelling the order: the market sustains internal changes which were not taken into account.
Phân tích vĩ mô Indices - Index chứng khoán Úc
Australia’s business capital expenditures rose in third quarter. Will the AU200 price advancing continue?
Australia’s private capital expenditure data released today were stronger than expected: Australian Bureau of Statistics reported new capital expenditure by private businesses increased by 1.1% over quarter in Q3, rebounding from a 2.2% decline in Q2 while an 0.9% rise was expected. On an industry basis, capital expenditure on buildings and structures and for manufacturing led the rebound as they increased by 27.2% and 17% respectively, partly offsetting a fall in mining industry spending on buildings and structures, which was down 2.5%. Rebounding capital expenditures by Australian private businesses is bullish for Australian gross domestic product and hence the AU200 stock index.
Lưu ý:
Bài tổng quan này mang tính chất tham khảo và được đăng miễn phí. Tất cả các dự liệu trong bài viết được lấy từ các nguồn thông tin mở và được công nhận đang tin cậy. Nhưng không có bất kỳ đảm bảo nào rằng thông tín hoàn toàn đang tin cậy. Sau này không điều chỉnh lại nữa. Tất cả thông tin trong bài tổng quan, bao gồm ý kiến, chỉ số, biểu đồ và khác chỉ mang tính chất tham khảo và không phải là lời khuyên đầu tư. Tất cả bài viết này không được xem xét như lời khuyên thúc đẩy để giao dịch. Công ty IFC Markets và nhân viên không chịu trách nghiệm cho bất kỳ quyết định của khách hàng sau khi đọc xong bài tổng quan.


