- 거래
- 상품 소개
- 합성상품 라이브러리
- Exxon Mobil Stocks vs Brent Investing
Exxon Mobil Stocks vs Brent - XOM Oil Trading
Exxon Stocks Description
The personal composite instrument «&XOM_Brent» reflects the price dynamics of the Exxon Mobil Corporation stock against the physically delivered Brent crude oil futures contract. The base part of this instrument is composed of 123 shares of Exxon Mobil Corporation shares and the quoted part - 274 barrels of Brent crude oil.
Oil is represented by the instrument #C-BRENT - the continuous CFD on Brent oil futures contract. The asset percentage content of the instrument is estimated on the basis of asset prices on the instrument creation date. The trading instrument &XOM_Brent is used for the analysis and trade of the price spread between the Exxon Mobil stock and physically delivered Brent crude futures contract.
Structure
Parameters
Trading hours
Application field
Structure
| &XOM/BRENT | № | 자산 | Volume / 1 PCI | Percentage | Volume (USD) / 1 PCI | Unit of measurеment |
|---|---|---|---|---|---|---|
| Base part | 1 | #S-XOM | 123.0000 | 10.000 | 10328.3100 | stock |
| Quoted part | 1 | #C-BRENT | 274.000 | 10.0000 | 11214.8200 | barrels |
Parameters
| Standard | Beginner | Demo | |
|---|---|---|---|
| 고정스프레드, 핍 | |||
| Floating Spread, pip | |||
| 주문거리, 핍 | |||
|
스왑, 핍 (롱/숏) | |||
|
이용가능 볼륨 | |||
| The value of 1 pip in USD for the Vol |
Trading hours
| Week day | 거래 시간 (CET, 중앙유럽표준시간) | 현지 거래 시간 |
| 월요일 | 15:30 — 22:00 | 15:30 — 22:00 |
| 화요일 | 15:30 — 22:00 | 15:30 — 22:00 |
| 수요일 | 15:30 — 22:00 | 15:30 — 22:00 |
| 목요일 | 15:30 — 22:00 | 15:30 — 22:00 |
| 금요일 | 15:30 — 22:00 | 15:30 — 22:00 |
| Saturday | — | — |
| Sunday | — | — |
Application field
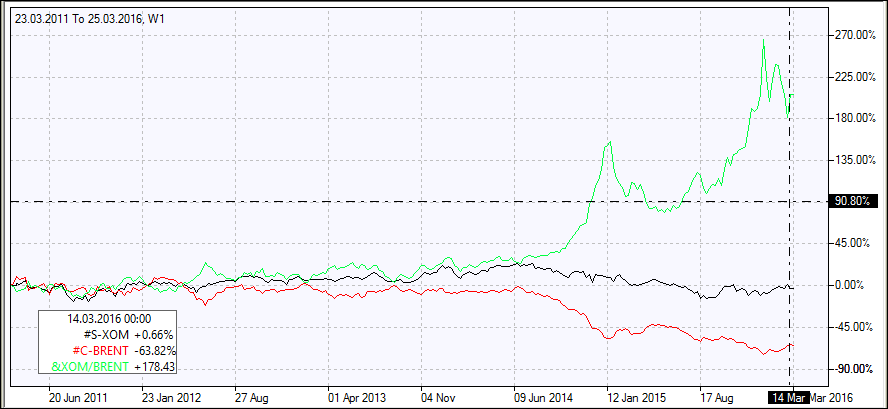
The personal composite trading instrument &XOM_Brent is used for Exxon Mobil and Brent oil pair trading, as well as multi-year comparative analysis of the spread and the instruments themselves – Exxon Mobil stock and Brent oil continuous futures contracts. For example, by building a percentage chart in the NetTradeX terminal for three instruments &XOM_Brent, #S-XOM and #C-BRENT (Fig.1) the 5-year dynamics of the ratio of prices of the oil company stock and crude oil and the price dynamics against USD for the stock and Brent crude oil can be studied.

Fig.1
Trading this personal instrument is analogous to trading the spread between the stock of the energy company and the Brent crude oil.
To trade PCI instruments offered exclusively by IFC Markets, you need to open a free account and download the NetTradeX platform.


