- 분석
- 기술적 분석
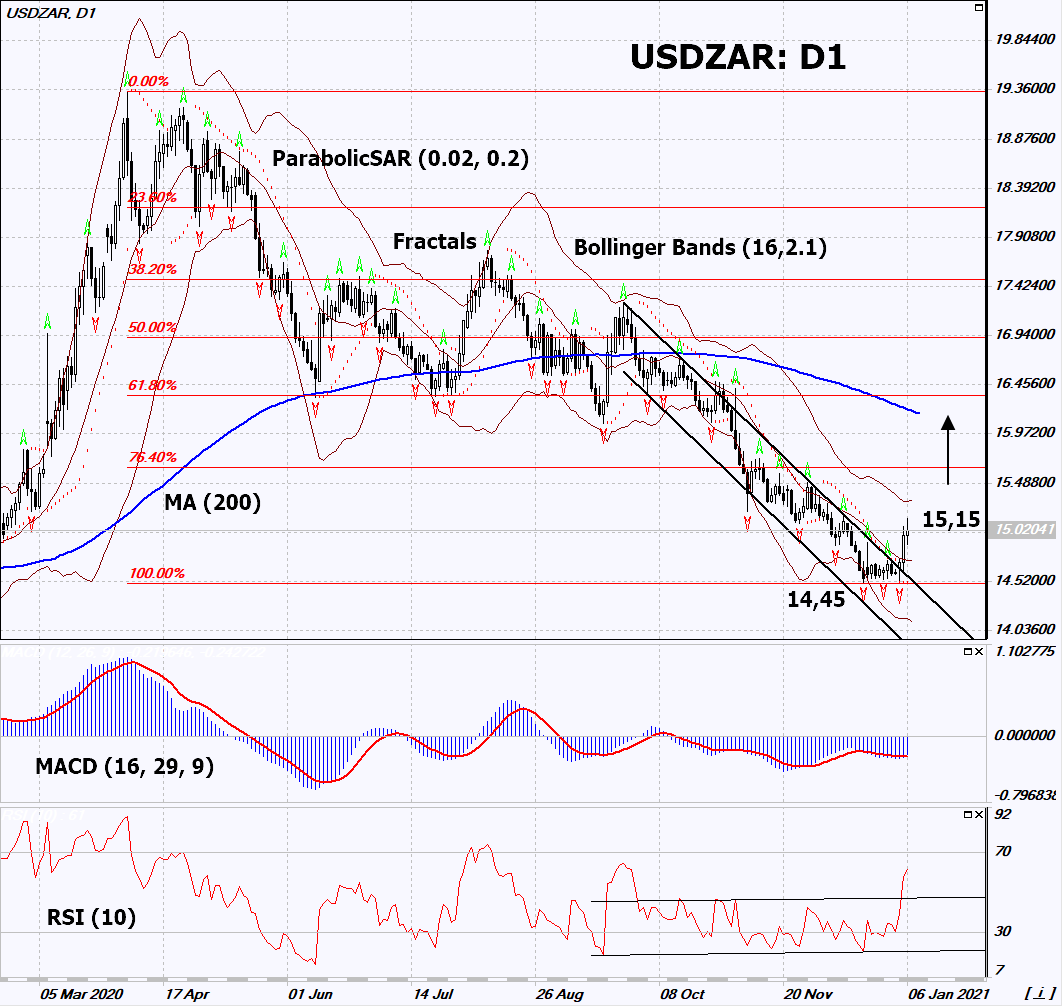
USD ZAR 기술적 분석 - USD ZAR 거래: 2021-01-07
USD/ZAR 기술적 분석 요약
위에 15.15
Buy Stop
아래에 14.45
Stop Loss
| 인디케이터 | 신호 |
| RSI | 중립적 |
| MACD | 구매 |
| MA(200) | 중립적 |
| Fractals | 중립적 |
| Parabolic SAR | 구매 |
| Bollinger Bands | 중립적 |
USD/ZAR 차트 분석
USD/ZAR 기술적 분석
On the daily timeframe, USDZAR: D1 moved up from the descending channel. A number of technical analysis indicators formed signals for further growth. We do not rule out a bullish move if USDZAR rises above its latest high: 15.15. This level can be used as an entry point. We can place a stop loss below the Parabolic signal, the last three lower fractals and the annual low: 14.45. After opening a pending order, we move the stop loss to the next fractal low following the Bollinger and Parabolic signals. Thus, we change the potential profit/loss ratio in our favor. After the transaction, the most risk-averse traders can switch to the four-hour chart and set a stop loss, moving it in the direction of the bias. If the price meets the stop loss (14.45) without activating the order (15.15), it is recommended to delete the order: the market sustains internal changes that have not been taken into account.
Forex - USD/ZAR 기본 분석
In the Republic of South Africa (RSA), the number of patients with coronavirus has increased. Will the USDZAR quotes grow ?
An upward movement signifies a weakening of the South African rand against the US dollar. At the end of December, a new mutation of the coronavirus - SARS-CoV-2 (501.V2) was discovered in South Africa. Current vaccines are likely to be ineffective against it. They are now being tested. Meanwhile, the number of people with Covid-19 in South Africa began to increase sharply and has already reached 15 thousand people a day. In early December there were about 4 thousand a day. In total, 1.12 million people fell ill in South Africa and 30.5 thousand died. International rating agencies Fitch and Moody's downgraded South Africa's ratings to a speculative level at the end of November 2020, and S&P did it even earlier.
Note:
해당 개요는 유익하고 튜토리얼적인 성격을 가지고 있으며 무료로 게시됩니다. 이 개요에 포함된 모든 데이터는 어느 정도 신뢰할 수 있는 것으로 간주되는 오픈 소스에서 받은 것입니다. 또한 표시된 정보가 완전하고 정확하다는 보장이 없습니다. 개요가 업데이트되지 않습니다. 의견, 인디케이터, 차트 및 기타 항목을 포함하여 각 개요의 전체 정보는 이해의 목적으로만 제공되며 재정적 조언이나 권장 사항이 아닙니다. 전체 텍스트와 그 일부, 차트는 자산과의 거래 제안으로 간주될 수 없습니다. IFC Markets와 그 직원은 어떤 상황에서도 개요를 읽는 동안 또는 읽은 후에 다른 사람이 취한 행동에 대해 책임을 지지 않습니다.


