- Analytics
- Market Data
- Precious Metals Prices
- XAUUSD Price Chart
XAUUSD Live Chart - Gold USD Prices
This page includes full information about the Gold, including the Gold live chart and dynamics on the chart by choosing any of 8 available time frames.
By moving the start and end of the timeframe in the bottom panel you can see both the current and the historical price movements of the instrument. In addition, you have an opportunity to choose the type of display of the Gold live chart – Candles or Lines chart – through the buttons in the upper left corner of the chart. All clients that have not yet decided which instrument to trade are in the right place since reading the full characteristics of the XAUUSD and watching its performance on the charts will help them to make their final decision.
XAUUSD Price Chart
- 1m
- 5m
- 15m
- 30m
- 1h
- 4h
- 1d
- 1w
This page includes full information about the Gold, including the Gold live chart and dynamics on the chart by choosing any of 8 available time frames.
By moving the start and end of the timeframe in the bottom panel you can see both the current and the historical price movements of the instrument. In addition, you have an opportunity to choose the type of display of the Gold live chart – Candles or Lines chart – through the buttons in the upper left corner of the chart. All clients that have not yet decided which instrument to trade are in the right place since reading the full characteristics of the XAUUSD and watching its performance on the charts will help them to make their final decision.
Technical Analysis
Technical analysis is a method of studying and evaluating market dynamics based on the price history. Its main purpose is to forecast price dynamics of a financial instrument in future through technical analysis tools. Technical analysts use this method of market analysis to forecast the prices of different currencies and currency pairs. This type of the analysis will allow you to make market forecast based on studying historical prices of the trading instruments.
See also latest technical analysis of the price dynamics of Gold Dollar: XAUUSD forecast.
XAUUSD News

Gold Price News Analysis: Will gold price go down?
Gold hit a record high of $3,016.92 per ounce, surpassing the...
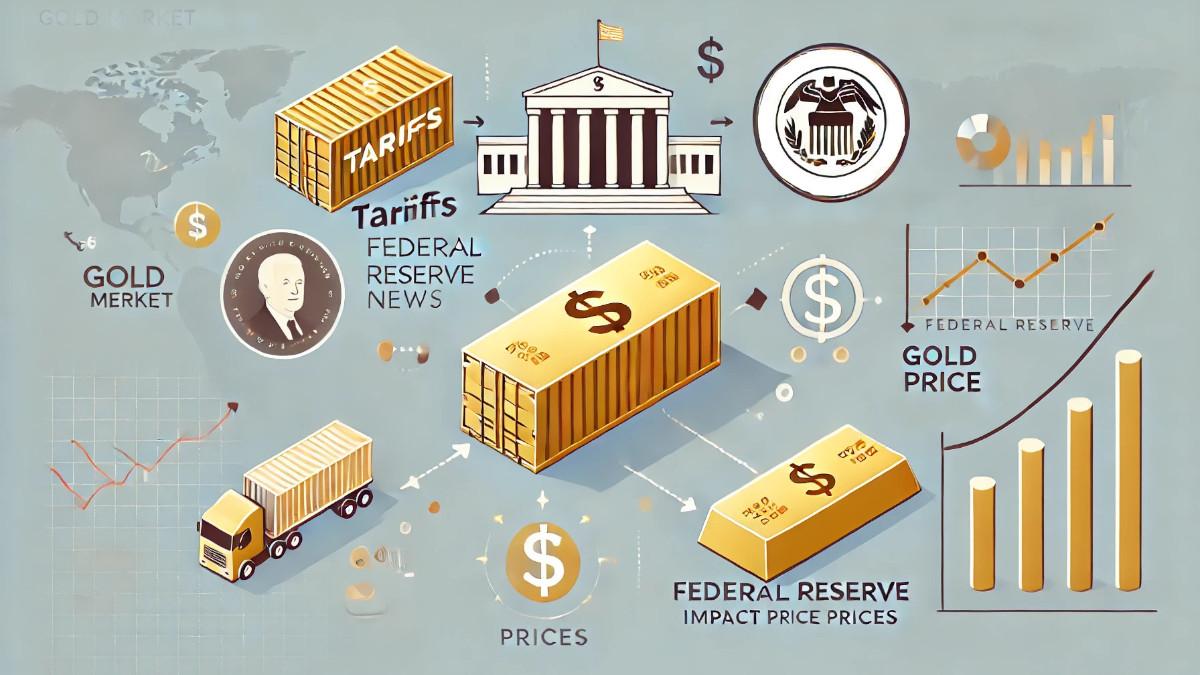
Gold Market News: How Tariffs and Fed Decisions Impact Prices
Gold prices held firm near record levels on Wednesday as investors...

US Elections and Gold Price
As the US prepares for a tense presidential election, gold prices...

Gold Steadies After Falling from Record Highs Due to Interest Rate Uncertainty
On Tuesday, gold prices steadied in Asian trading after a recent...

Gold Demand Falling Amid Record Prices: Retail Investors Opt for Profit-Taking
Physical gold demand has dropped across key markets as rising...

Gold Prices Hold Steady Ahead of Key Inflation Report
Gold prices remained relatively stable, hovering near the $2,500...