- Analytics
- Technical Analysis
Cotton Technical Analysis - Cotton Trading: 2017-12-15
Cotton prices rise on US stocks forecast cut
Cotton prices advance as US cotton stock forecast was lowered. Will cotton continue rising?
In the December 11 World Agricultural Supply and Demand Estimates report, the US Department of Agriculture revised downward the 2017-18 US cotton stocks by 300 thousand bales (480-pound each) to 5.80 million bales. At the same time declining US yields as harvest continues point to possible US crop downgrade. Lower US stocks and expected lower crop are bullish for cotton prices.
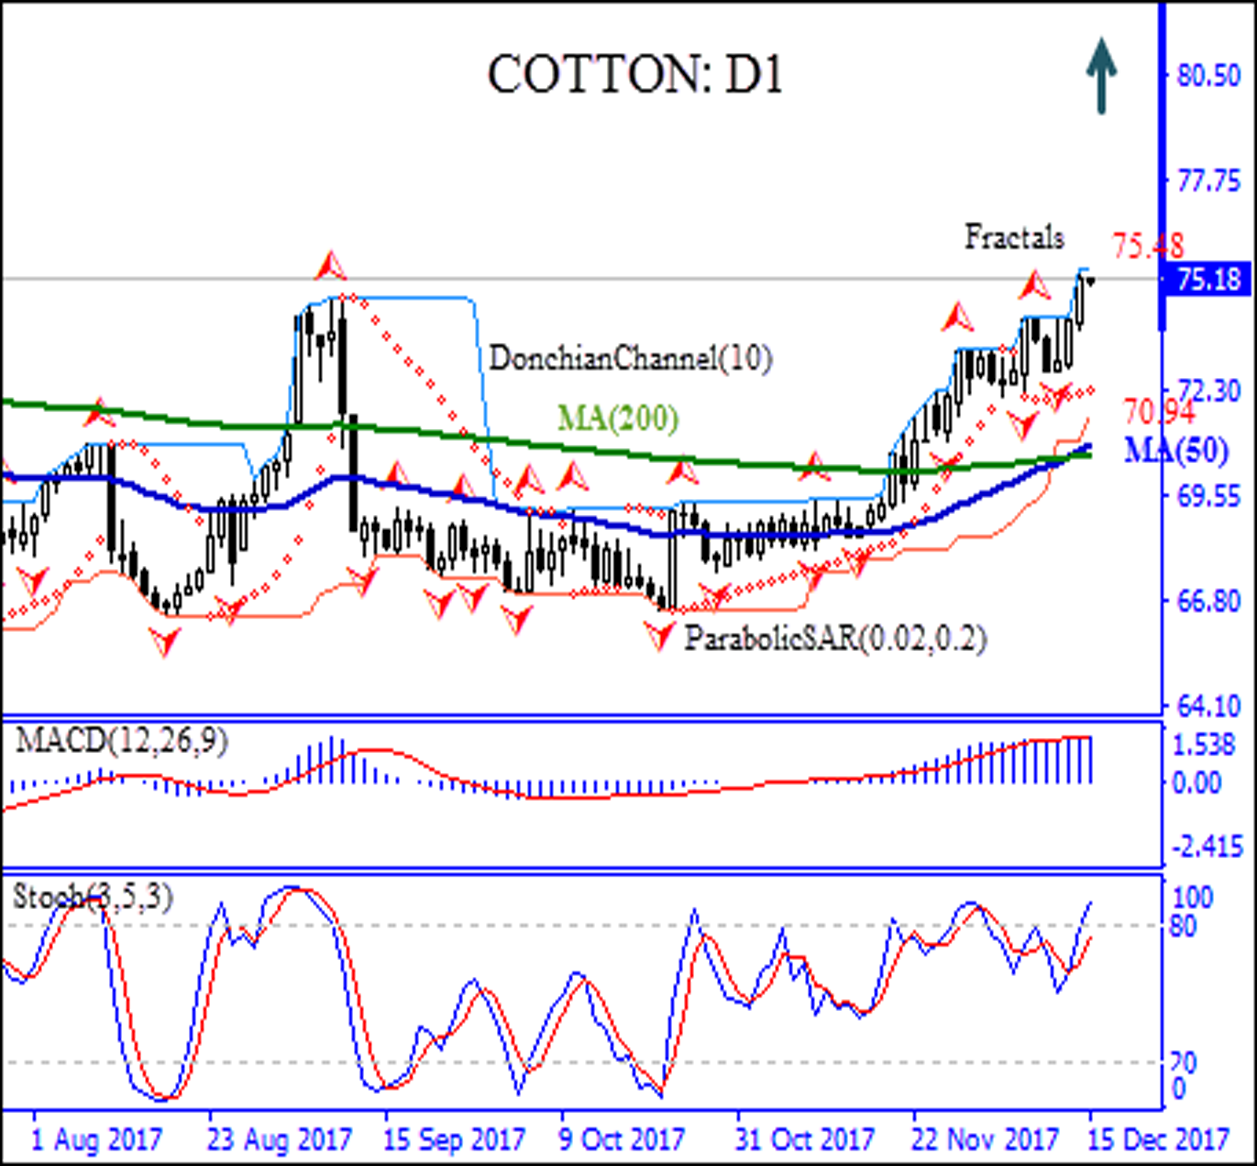
On the daily timeframe the Cotton: D1 has been retracing following the decline after hitting six-month high in beginning of September. A bullish Golden Cross chart pattern with 50-day moving average MA(50) crossing above the 200-day moving average MA(200) price from below has formed.
- The Parabolic indicator has formed a buy signal.
- The Donchian channel indicates an uptrend: it is tilted upward.
- The MACD indicator gives a bullish signal.
- The Stochastic oscillator is in the overbought zone, which is a bearish signal.
We expect the bullish momentum will continue after the price breaches above the upper Donchian bound at 75.48. This level can be used as an entry point for a pending order to buy. The stop loss can be placed below the lower Donchian bound at 70.94. After placing the pending order, the stop loss is to be moved to the next fractal low, following Parabolic signals. By doing so, we are changing the probable profit/loss ratio to the breakeven point. If the price meets the stop loss level (70.94) without reaching the order (75.48), we recommend canceling the position: the market sustains internal changes which were not taken into account.
Technical Analysis Summary
| Position | Buy |
| Buy stop | Above 75.48 |
| Stop loss | Below 70.94 |
- Get Certificate

Note:
This overview has an informative and tutorial character and is published for free. All the data, included in the overview, are received from public sources, recognized as more or less reliable. Moreover, there is no guarantee that the indicated information is full and precise. Overviews are not updated. The whole information in each overview, including opinion, indicators, charts and anything else, is provided only for familiarization purposes and is not financial advice or а recommendation. The whole text and its any part, as well as the charts cannot be considered as an offer to make a deal with any asset. IFC Markets and its employees under any circumstances are not liable for any action taken by someone else during or after reading the overview.
