- Trading
- Instrument Specifications
- Synthetic Instruments Library
- Brent Crude vs Russian Ruble Investing
Brent Crude vs Russian Ruble - Brent RUB Trading
Brent Crude vs Russian Ruble Investing
Type:
PCIInstrument : &BRENT/RUB
Brent vs Ruble Description
The personal composite instrument &BRENT/RUB reflects the price dynamics of Brent barrel against the Russian ruble. The instrument is composed by quoting the Brent futures against the Russian ruble on the basis of the cross-rate model. The base and quoted parts of the spread are quoted in US dollars. Oil is represented by the instrument #C-BRENT - the continuous contract for difference (CFD) on Brent futures.
Advantage
It should be noted that the &BRENT/RUB spread instrument is used for the fundamental analysis of Russian Federation (RF) macroeconomic policy and trading inside a price channel: buying near the support line, selling near the resistance line.
Characteristics of the personal composite instrument &BRENT/RUB:
- The source of the RF Central Bank official reserves are the super-profits from the sales of energy resources. Oil export accounts for 66% (2014) of total energy resource exports. Revenues from energy industry account for 51% of the federal budget revenues, which allows predicting the trends for increasing the public sector financing and economic stimulus programs;
- The determinants of the long term rating of the Russian economy are the world oil prices and the official reserves of the country, which ensure the stability and creditworthiness of the economy. Therefore, increasing energy resource prices can result in the ruble strengthening, while falling energy resource prices have the opposite effect. Over the last year the Brent/Ruble correlation reached 70%. From November 2012 to September 2014 the Russian ruble lost 22% of its value, and came close to the mark of 39 rubles per US dollar. It is noteworthy that during the same period BRENT crude oil has fallen in price from 128 to 98 dollars per barrel, i.e. by 23%. The comparability of these two values confirms the possibility of the "mean reversion" strategy.
You can find the theoretical foundations for the index formation in the “Application field” section below.
Structure
Parameters
Trading hours
Application field
Structure
| &BRENT/RUB | № | Asset | Volume / 1 PCI | Percentage | Volume (USD) / 1 PCI | Unit of measurеment |
|---|---|---|---|---|---|---|
| Base part | 1 | #C-BRENT | 4.4271 | 37.790 | 377.9000 | barrels |
| Quoted part | 1 | RUB | 4.286 | 0.0100 | 0.1000 | RUB |
Parameters
| Standard | Beginner | Demo | |
|---|---|---|---|
| Fixed spread, pip | |||
| Floating Spread, pip | |||
| Order distance, pip | |||
| Swap (long/short) in pips on Vol | |||
|
Available volumes | |||
| The value of 1 pip in USD for the Vol |
Trading hours
| Week day | Trading hours (CET) | Local trading hours |
| Monday | 08:00 — 17:00 | 08:00 — 17:00 |
| Tuesday | 08:00 — 17:00 | 08:00 — 17:00 |
| Wednesday | 08:00 — 17:00 | 08:00 — 17:00 |
| Thursday | 08:00 — 17:00 | 08:00 — 17:00 |
| Friday | 08:00 — 17:00 | 08:00 — 17:00 |
| Saturday | — | — |
| Sunday | — | — |
Application field
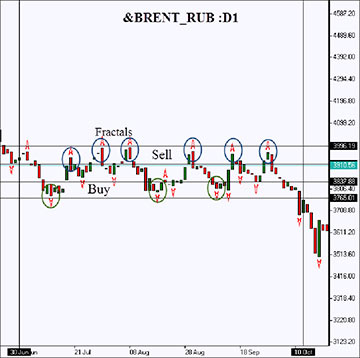
From June to October 2014 the price of one barrel of Brent oil declined by 20%. Within the same time period the Russian ruble exchange rate against the US dollar (RUB/USD) decreased by 30%, which is a comparable rate of change. Such a relationship is explained by the decision of the Central Bank to let the ruble depreciate in order to preserve the budget revenues which are mainly comprised of receipts from oil exports. Due to the monetary policy of the Russia’s Central Bank, the change in &BRENT/RUB personal composite instrument didn’t exceed 5% during the period under consideration. At the same time, the price of the spread instrument moved within a price channel (see Fig.1). With the Central Bank not intervening in order to keep the exchange rate within a target corridor, the supply and demand in world energy markets strongly influences the ruble exchange rate. In 2014 the positive correlation between the Brent price and Russian ruble was 70%.
The implicit influence of oil prices should also be taken into account. The Russian corporation Gazprom has a monopoly on gas exports, and it sells gas to Europe and CIS under long term contracts, where the price is rigidly tied to world oil prices. Thus, the decline in Brent price automatically results in falling gas revenues, which, jointly with the oil exports, comprise 51% of Russian budget revenues.
Starting from 2015 the Central Bank of Russia plans to cease the rigid exchange rate management. In case this happens, the likelihood of &BRENT/RUB staying range bound will increase considerably, since ruble will become a full “commodity” currency.

Fig.1. "&BRENT/RUB" PCI daily chart (2014)

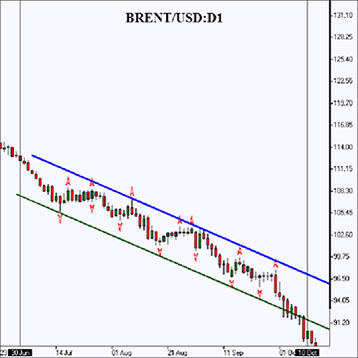
Fig.2. Brent daily chart (2014)
The two charts display the trending Brent futures prices and the sideways movement of the &BRENT/RUB personal composite instrument. The green ovals mark the implied areas for buying, while the blue ovals mark areas for selling the instrument. Buying is carried out in the lower third part of the range corridor, selling – in the upper part. Thus, a beneficial return/risk ratio is achieved. The Stop loss can be placed below the support level (when buying), or resistance (selling) respectively. During the period under consideration 3 deals for buying and 6 deals for selling were concluded, of which only one was a losing trade.
To trade PCI instruments offered exclusively by IFC Markets, you need to open a free account and download the NetTradeX platform.
- Clients Also Trade These Instruments


