- Analytics
- Technical Analysis
Dow Jones Index Technical Analysis - Dow Jones Index Trading: 2017-12-14
Continuing expansion bullish for DJI
The Federal Reserve hiked fed funds rate into the range 1.25% -1.5%. Will DJI continue rising?
The Federal Reserve raised rates 0.25 percentage point after recent positive data: inflation rose to 2.2% in November from 2.0% in October; US producer price index jumped 0.4% in November, gaining 3.1% over the past 12 months; and November reading on small-business confidence rose to its second-highest level on record. Positive data and continuing economic expansion are bullish for US stocks.
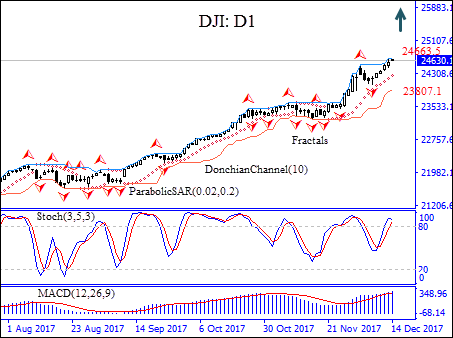
On the daily chart the DJI: D1 has been edging higher after a correction two weeks ago. The price has remained above the 50-day moving average MA(50).
- The Donchian channel is tilting higher, indicating an uptrend.
- The Parabolic indicator gives a buy signal.
- The MACD indicator also gives a bullish signal.
- The stochastic oscillator is in the overbought zone, this is a bearish signal.
We believe the bullish momentum will continue after the price closes above the upper Donchian bound at 24663.50. It can be used as an entry point for a pending order to buy. The stop loss can be placed below the lower Donchian bound at 23807.10. After placing the pending order the stop loss is to be moved every day to the next fractal low, following Parabolic signals. Thus, we are changing the probable profit/loss ratio to the breakeven point. More conservative traders can switch to the 4-hour chart and move the stop-loss in the direction of the trade. If the price meets the stop loss level (23807.10) without reaching the order(24663.50), we recommend cancelling the position: the market sustains internal changes which were not considered.
Technical Analysis Summary
| Position | Buy |
| Buy stop | Above 24663.50 |
| Stop loss | Below 23807.1 |
- Get Certificate

Note:
This overview has an informative and tutorial character and is published for free. All the data, included in the overview, are received from public sources, recognized as more or less reliable. Moreover, there is no guarantee that the indicated information is full and precise. Overviews are not updated. The whole information in each overview, including opinion, indicators, charts and anything else, is provided only for familiarization purposes and is not financial advice or а recommendation. The whole text and its any part, as well as the charts cannot be considered as an offer to make a deal with any asset. IFC Markets and its employees under any circumstances are not liable for any action taken by someone else during or after reading the overview.
